In the Stopwatch tutorial series you learned implicity how to use the Preview or Canvas area to see your code.
In this mini-tutorial you will explicitly learn the difference between:
- seeing a Preview of your code for part of your app
- seeing all of your code run on a simulated device
Both ways of running your code have advantages, depending on what you are trying to test.
Obtain the example project
This will be easier to understand if you have some code to try out while following this mini-tutorial.
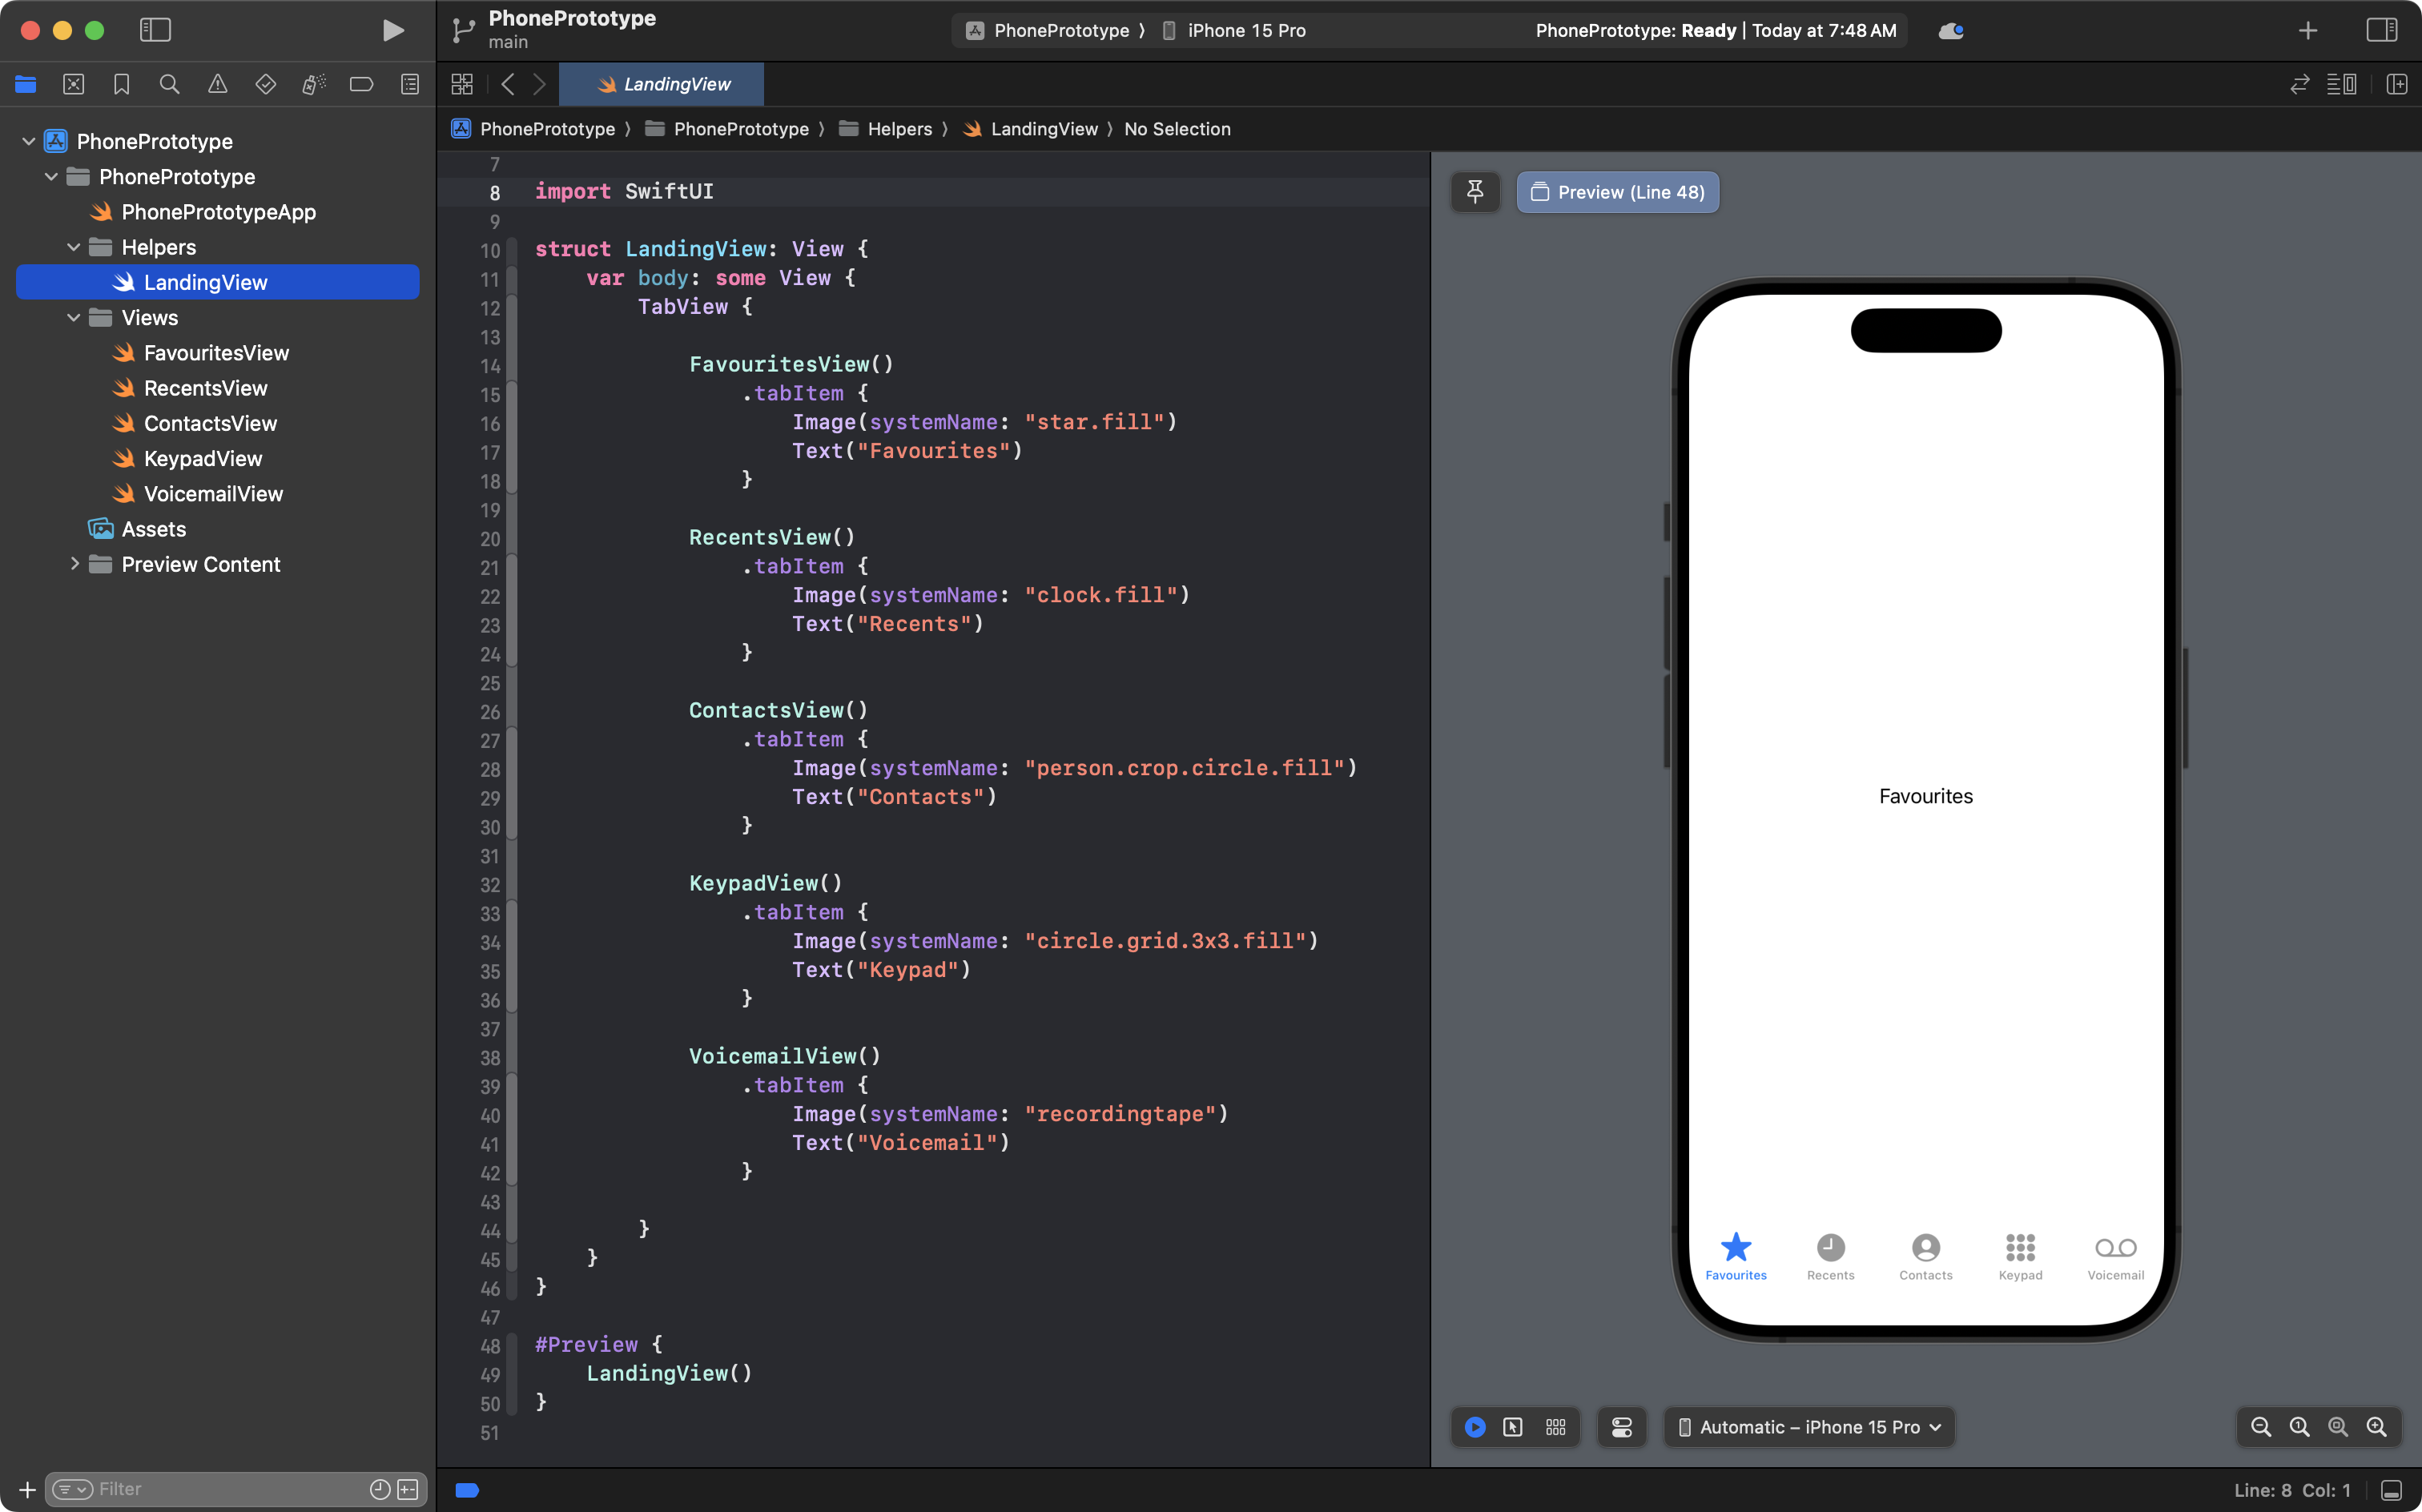
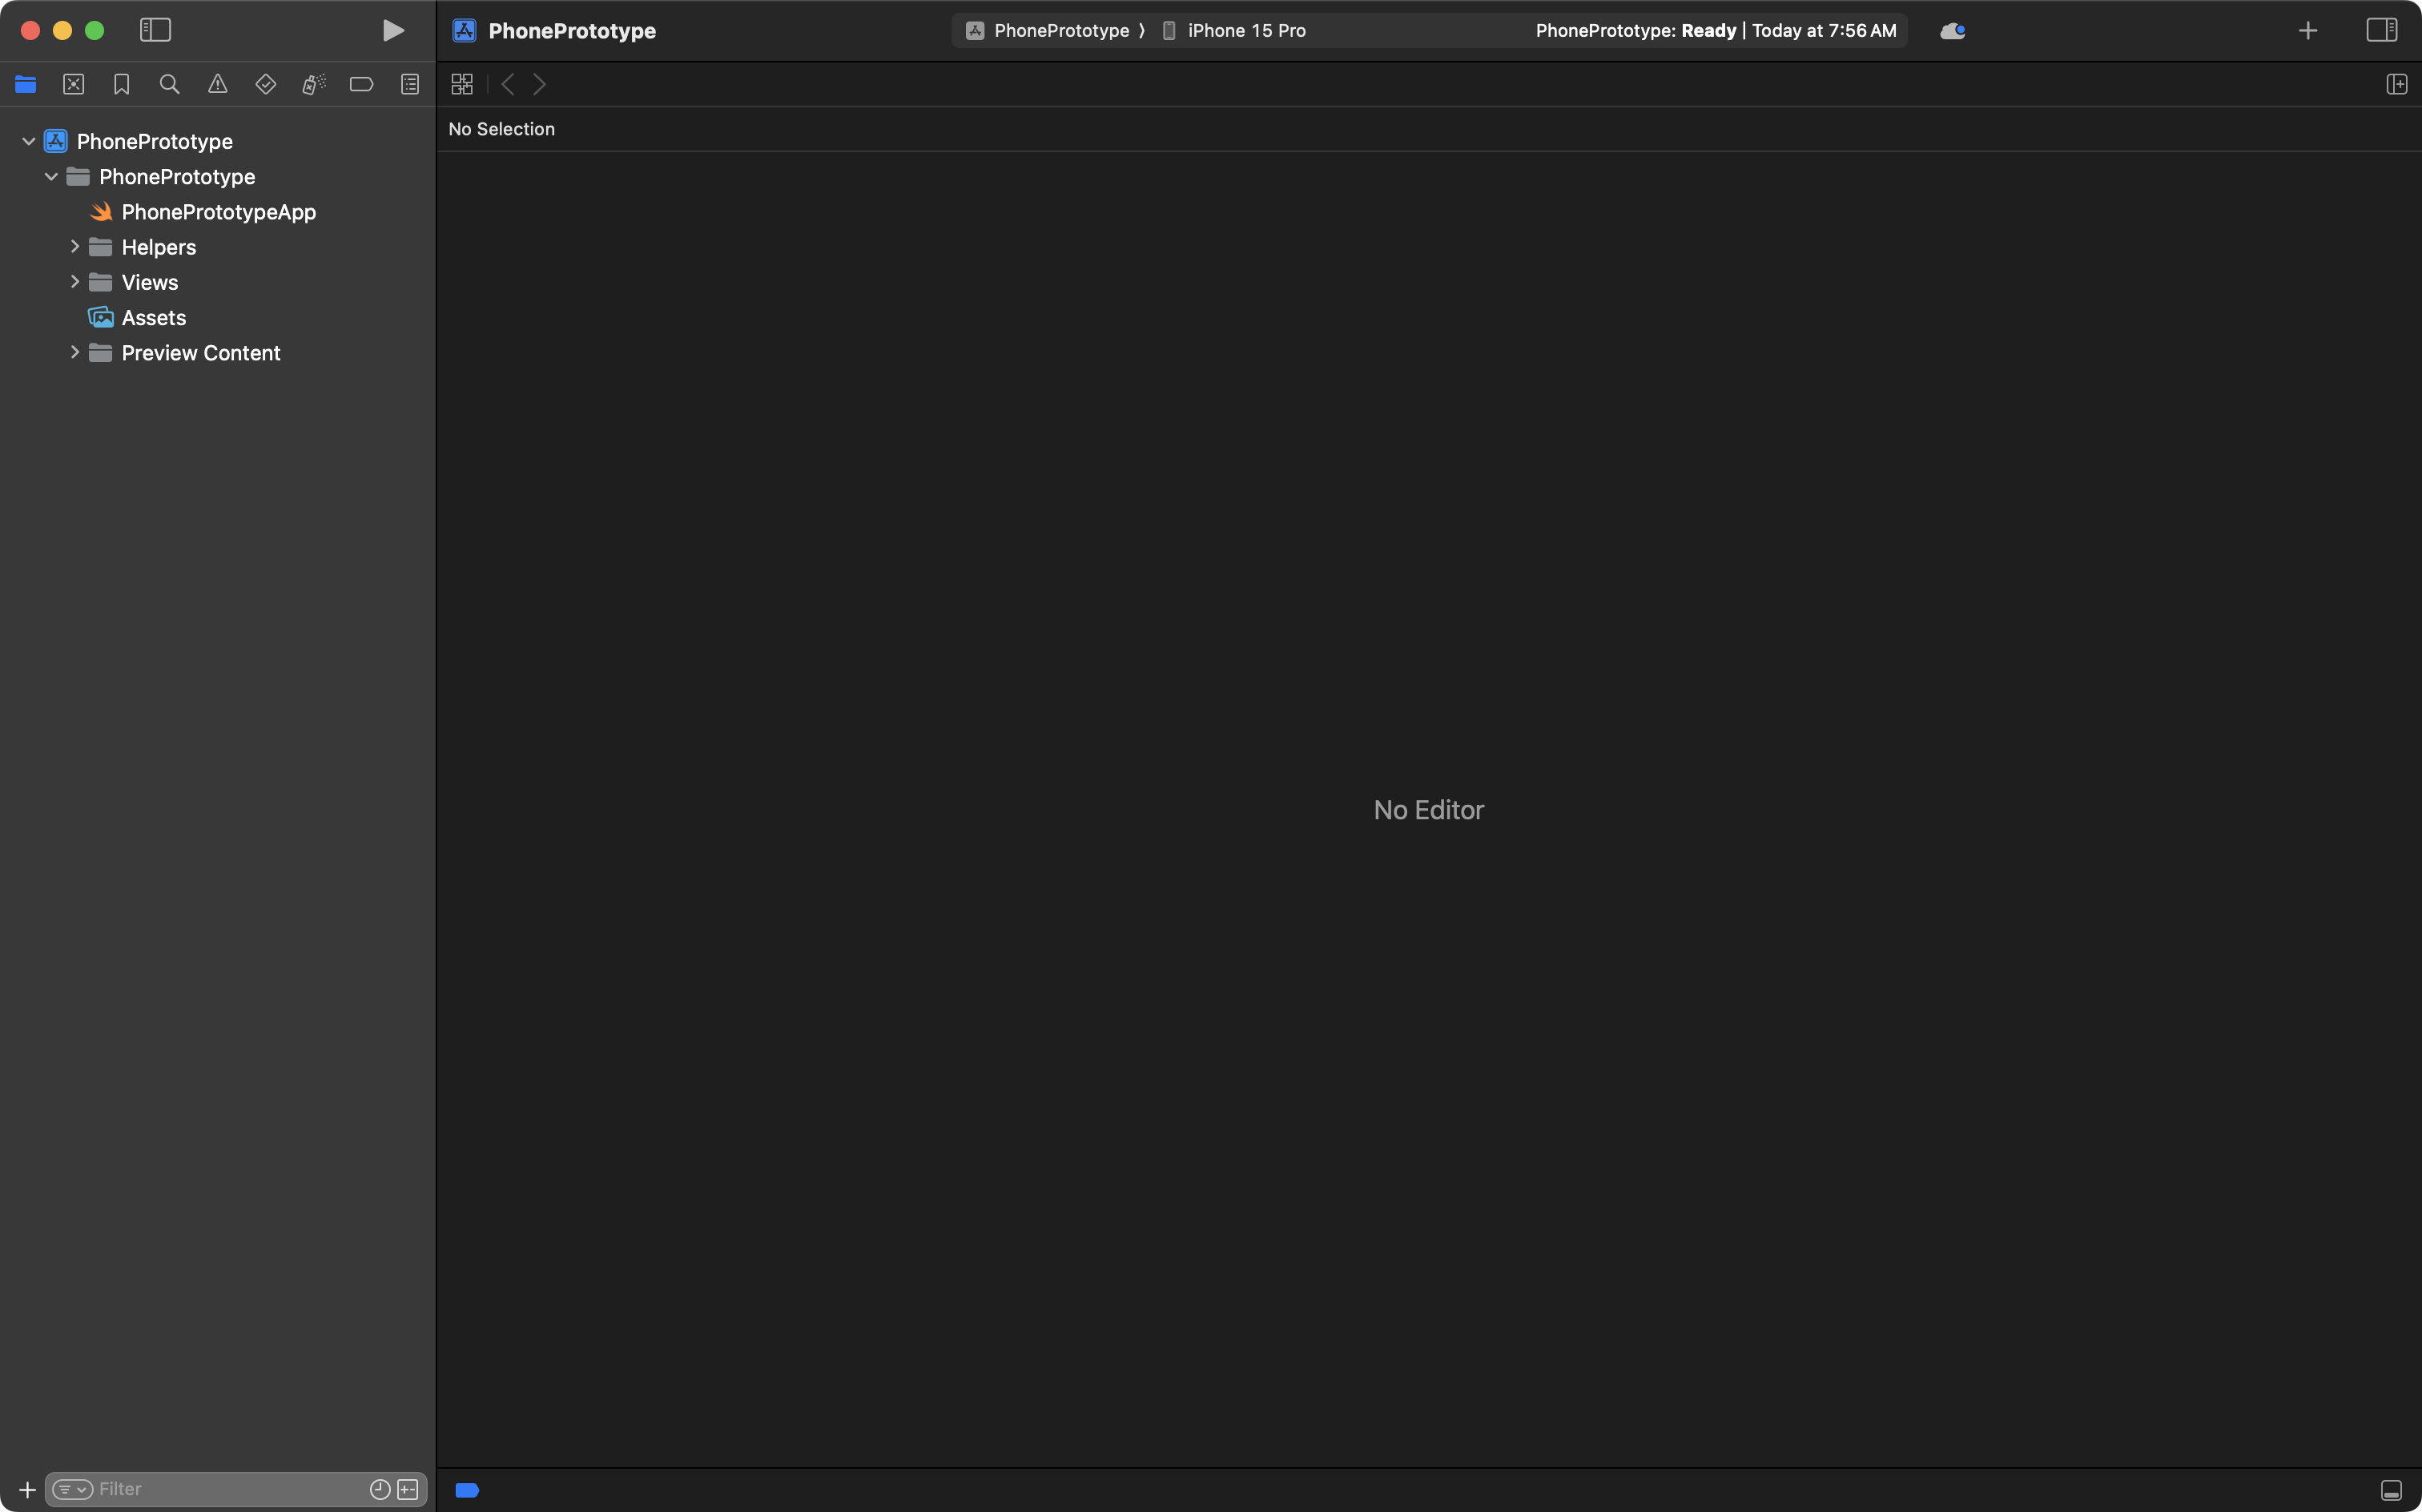
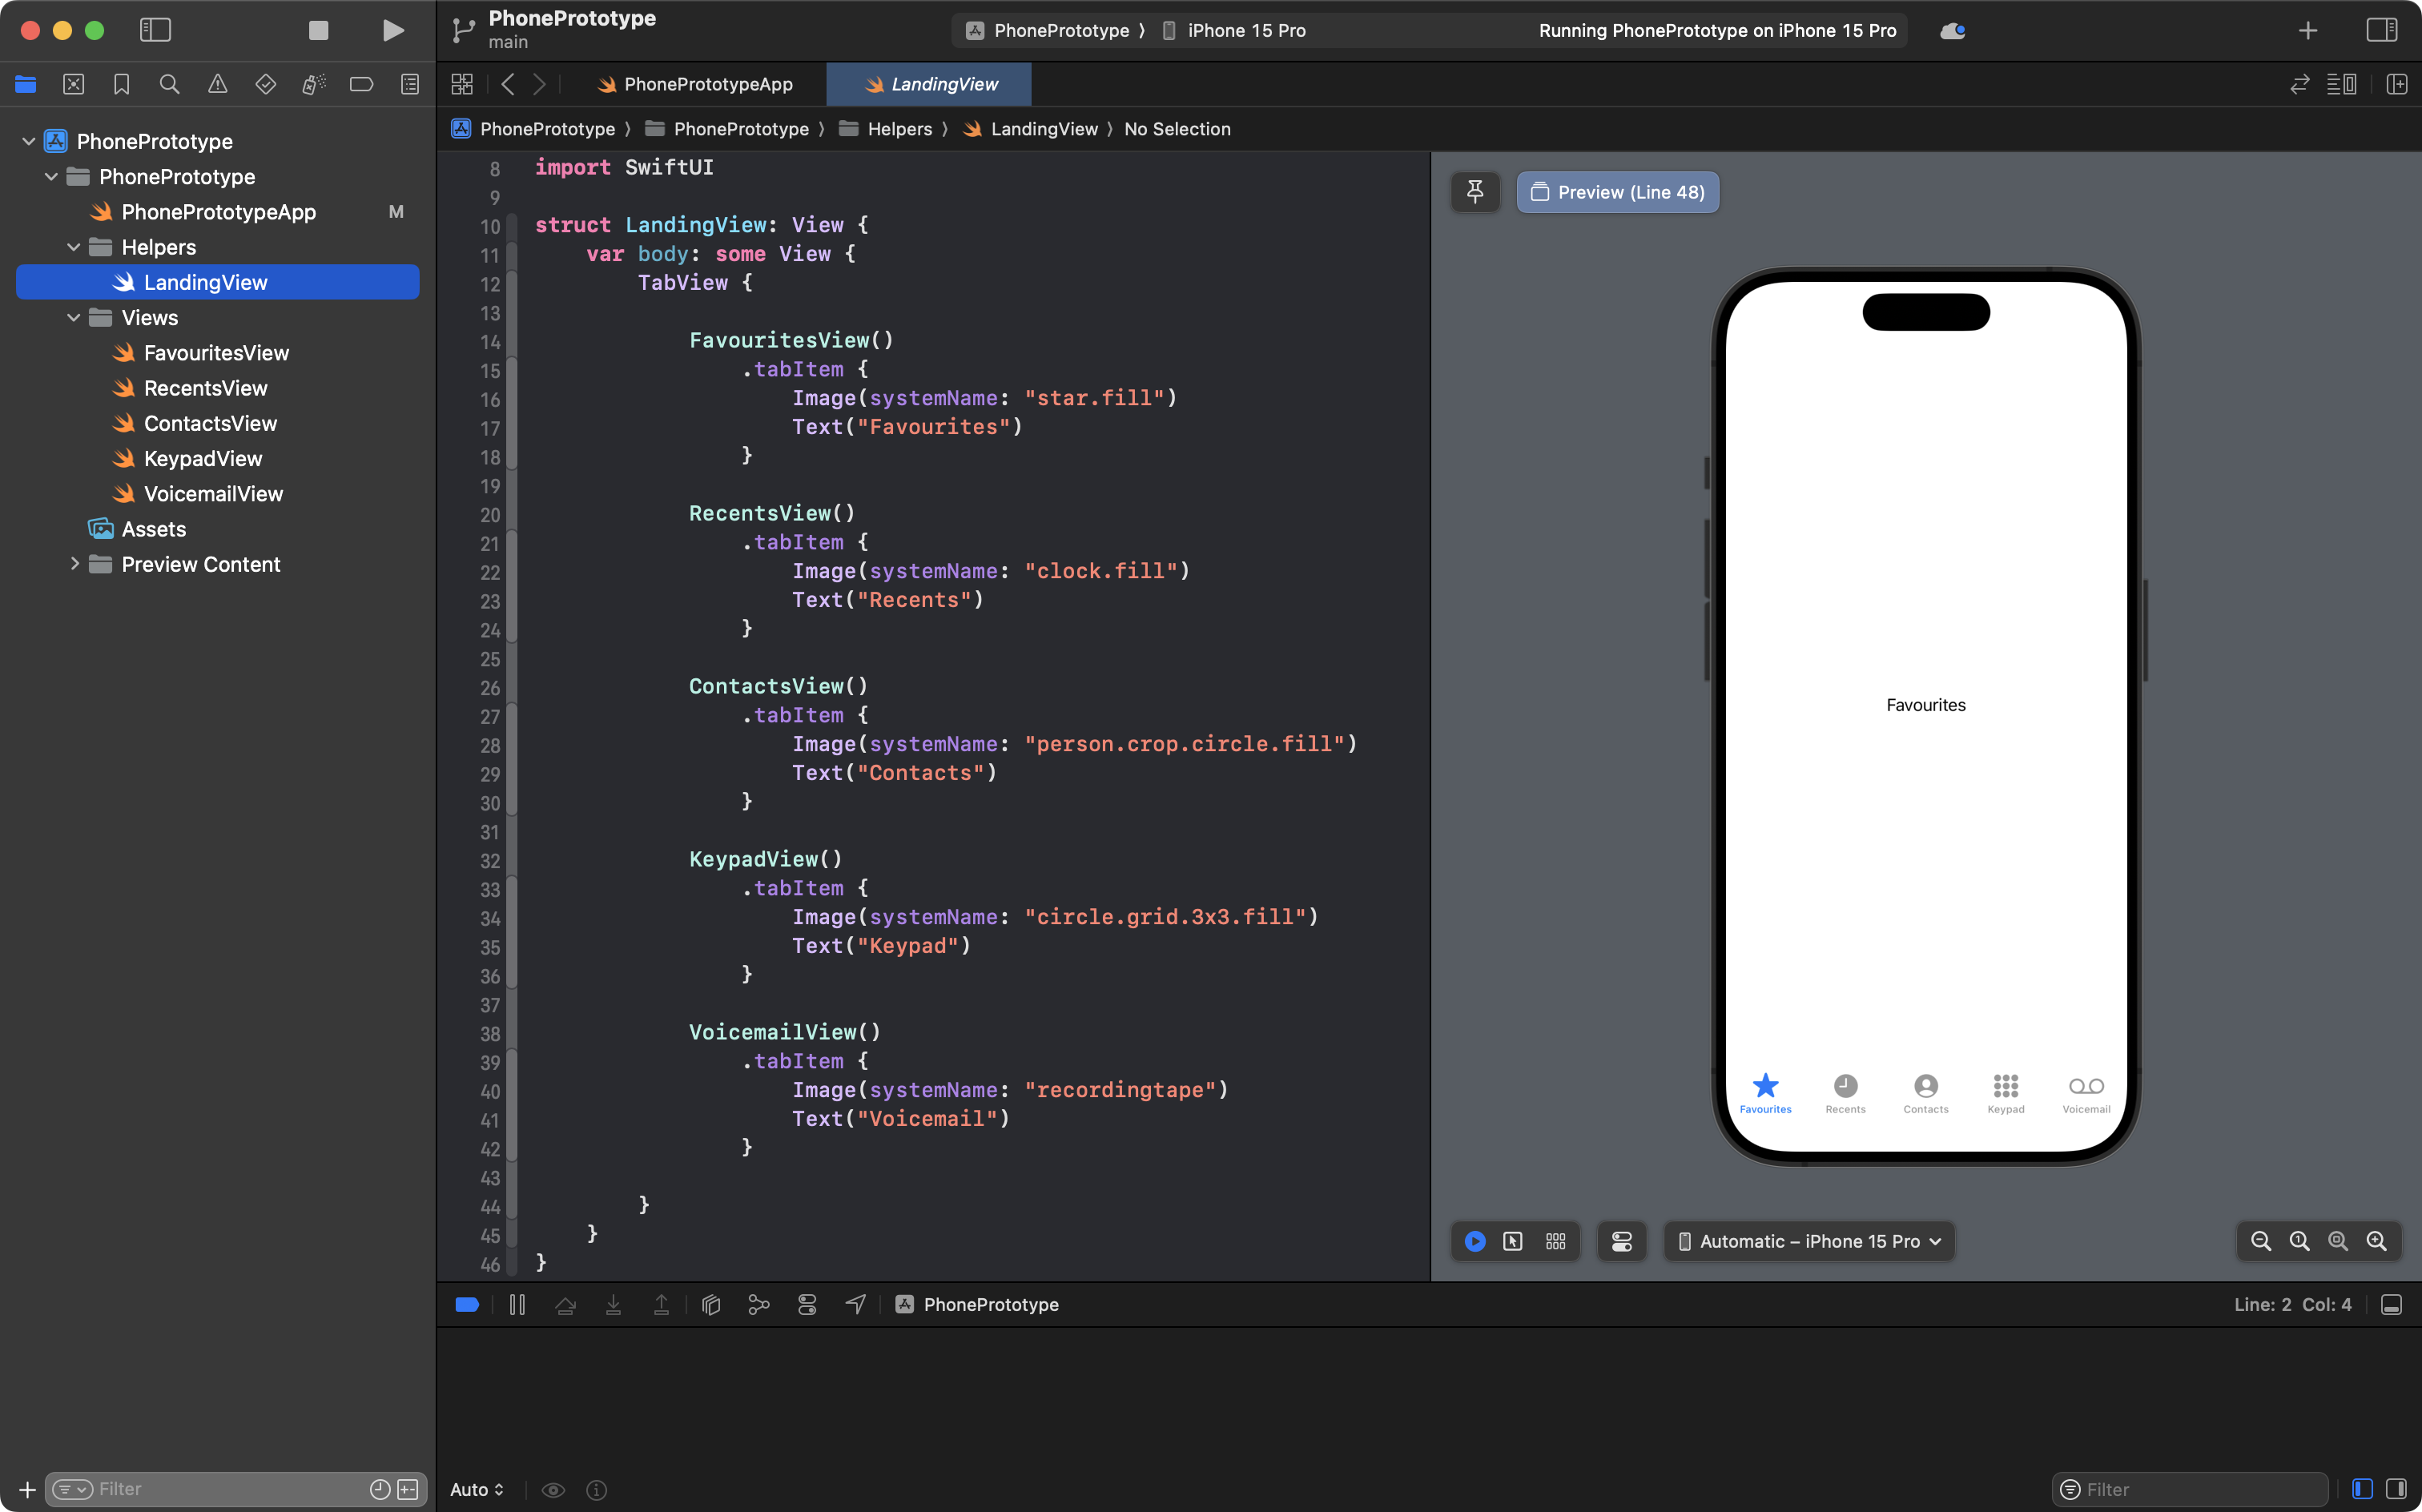
The PhonePrototype project is an “empty” version of the Phone app interface for iOS. Only the tab view at the bottom of the app’s interface has been implemented:
Please download the PhonePrototype project shown here so you can try it out.
Expand the compressed file
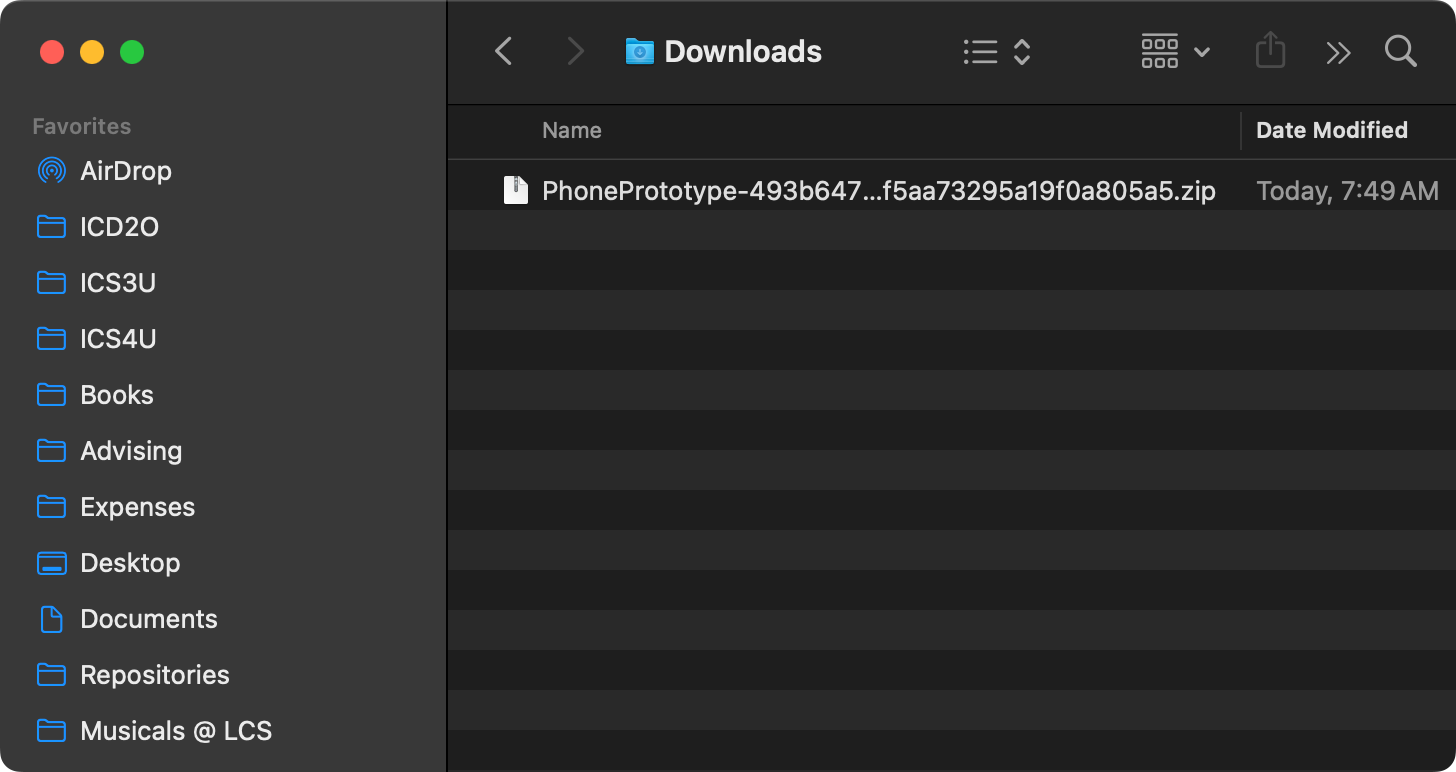
When you follow the link above, you will end up with a compressed file in your Downloads folder:
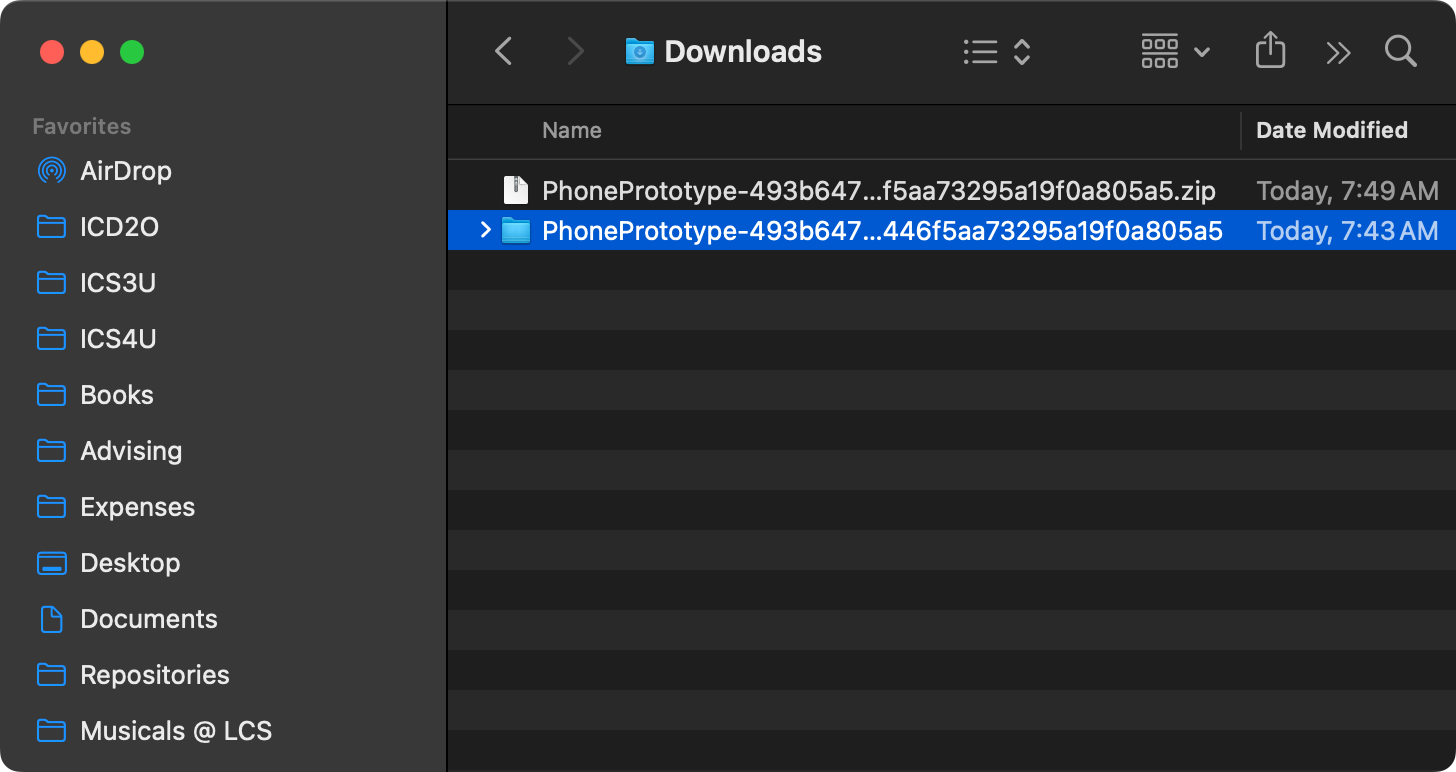
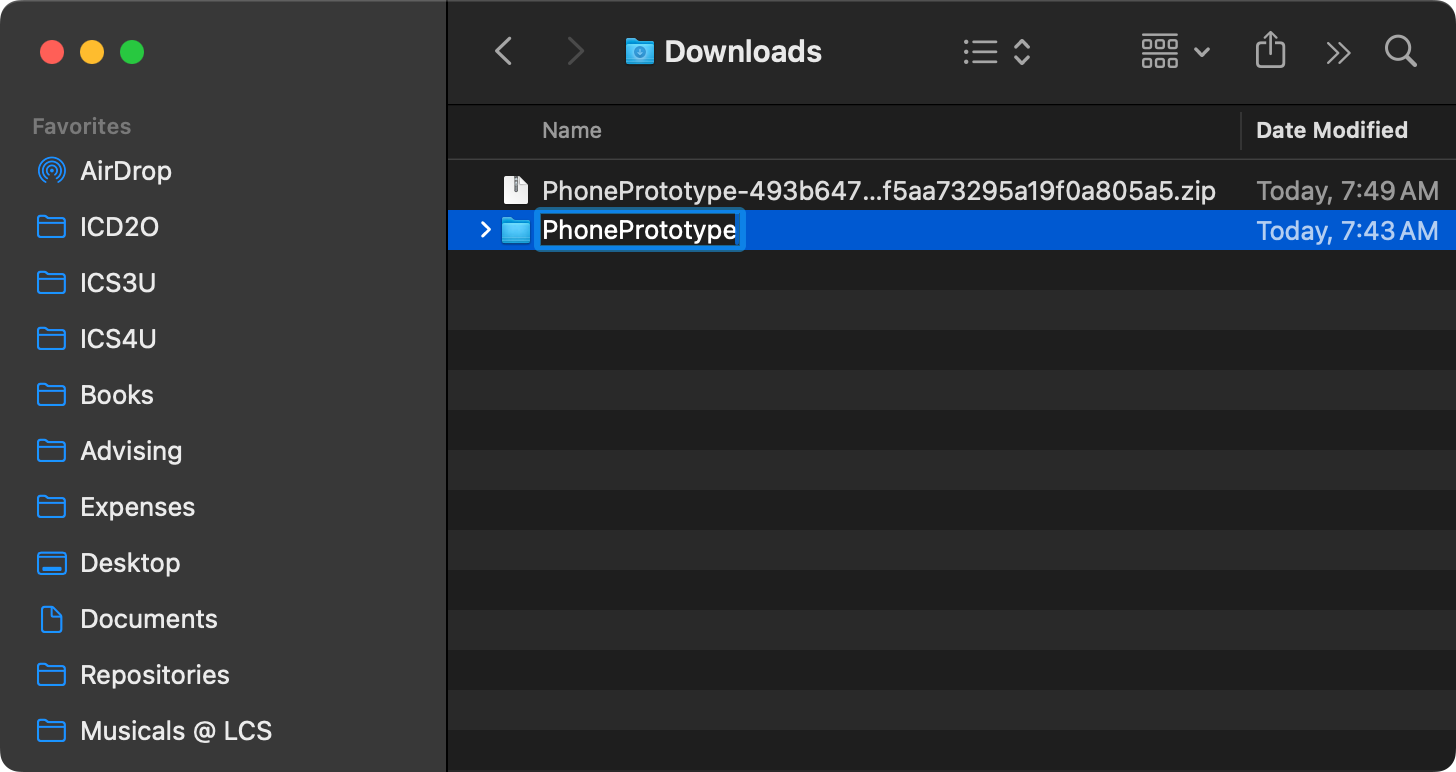
Double-click to expand the compressed file and you will see a folder whose name starts with PhonePrototype and is then followed by a long series of letters and numbers:
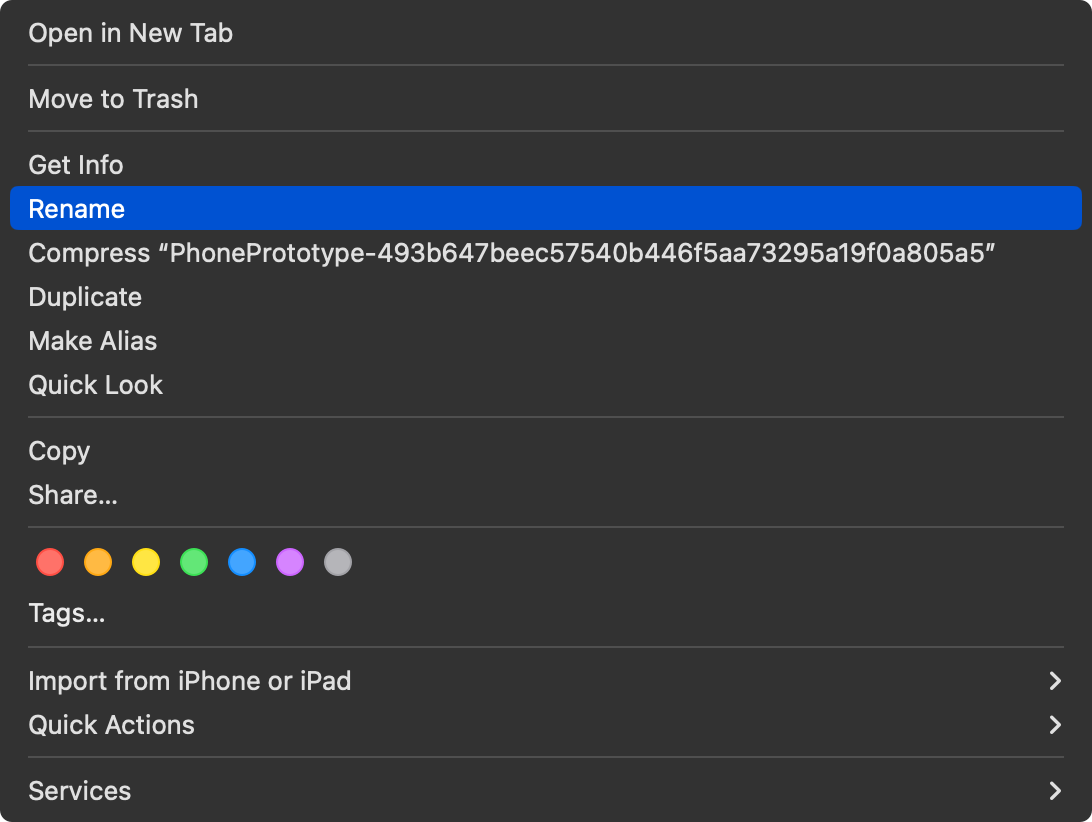
Two-finger tap or right-click the folder and choose to rename it:
Remove the letters and numbers so the name of the folder is just PhonePrototype:
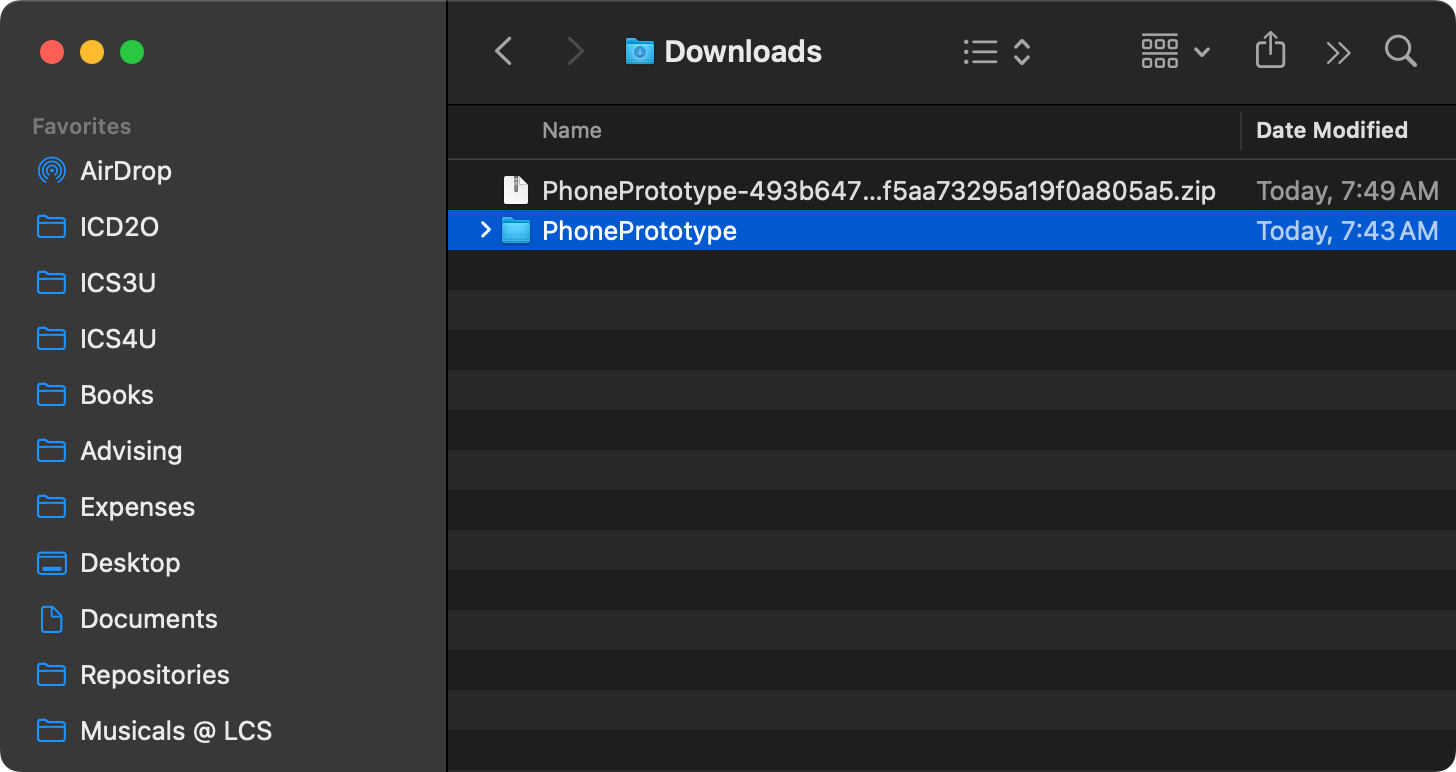
When you are done you should see something like this:
Organize and open the project
Now move the PhonePrototype folder to your own Computer Science folder, wherever that might be.
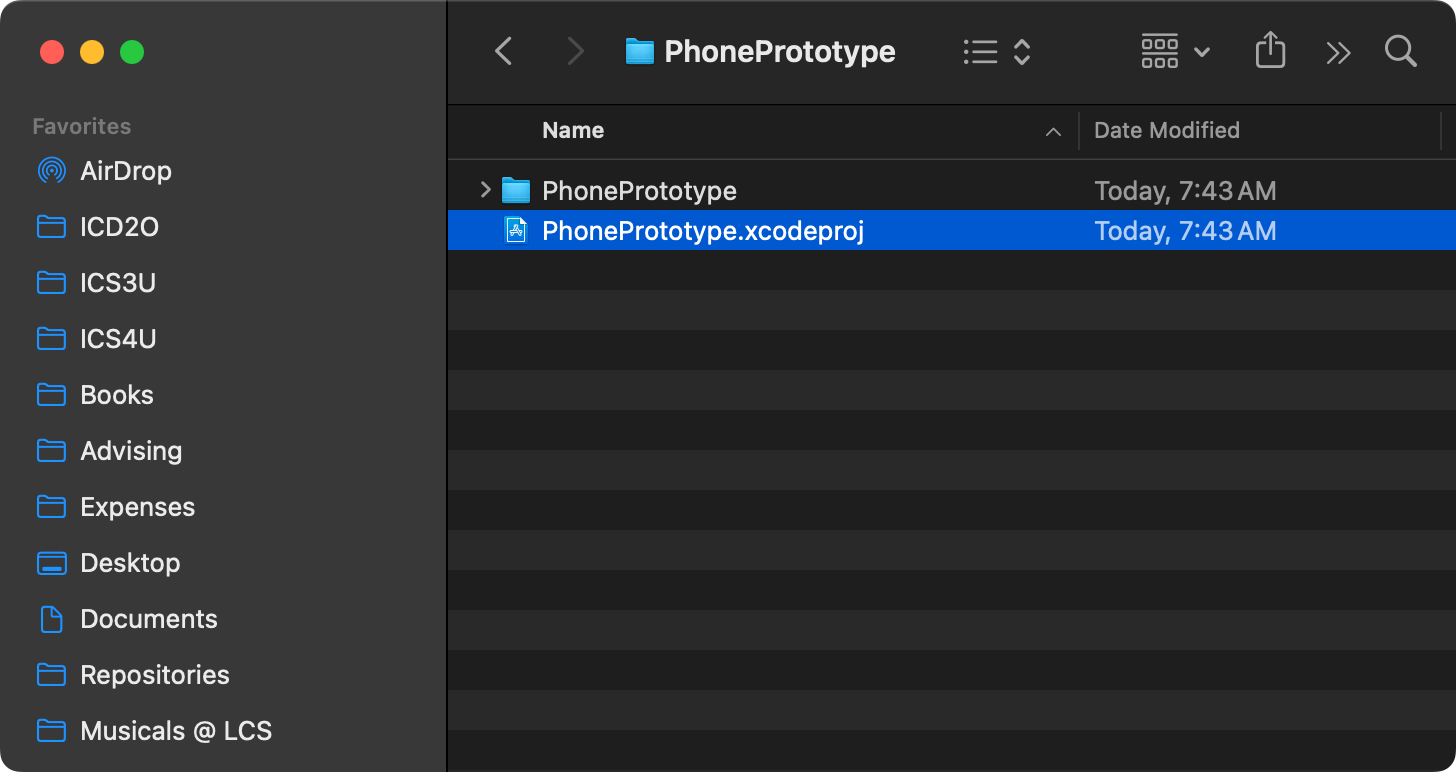
Then double-click to open the folder, and double-click the PhonePrototype.xcodeproj file:
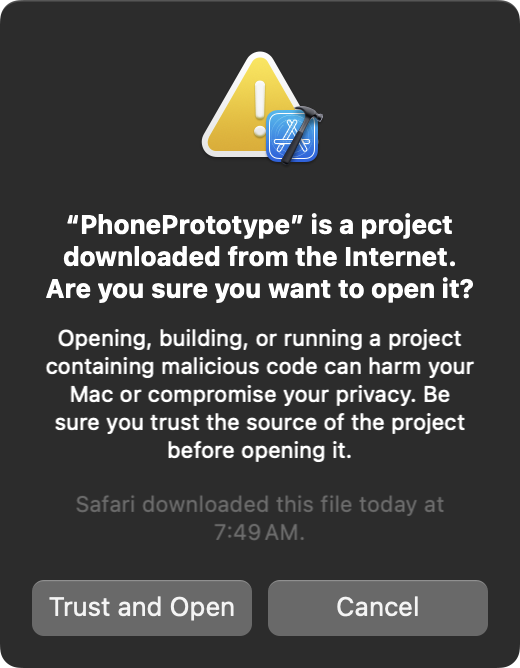
You will see a warning dialog box like the following – since you downloaded this project from Mr. Gordon – you can trust it. Go ahead and select Trust and Open:
After opening the project you will see something like this:
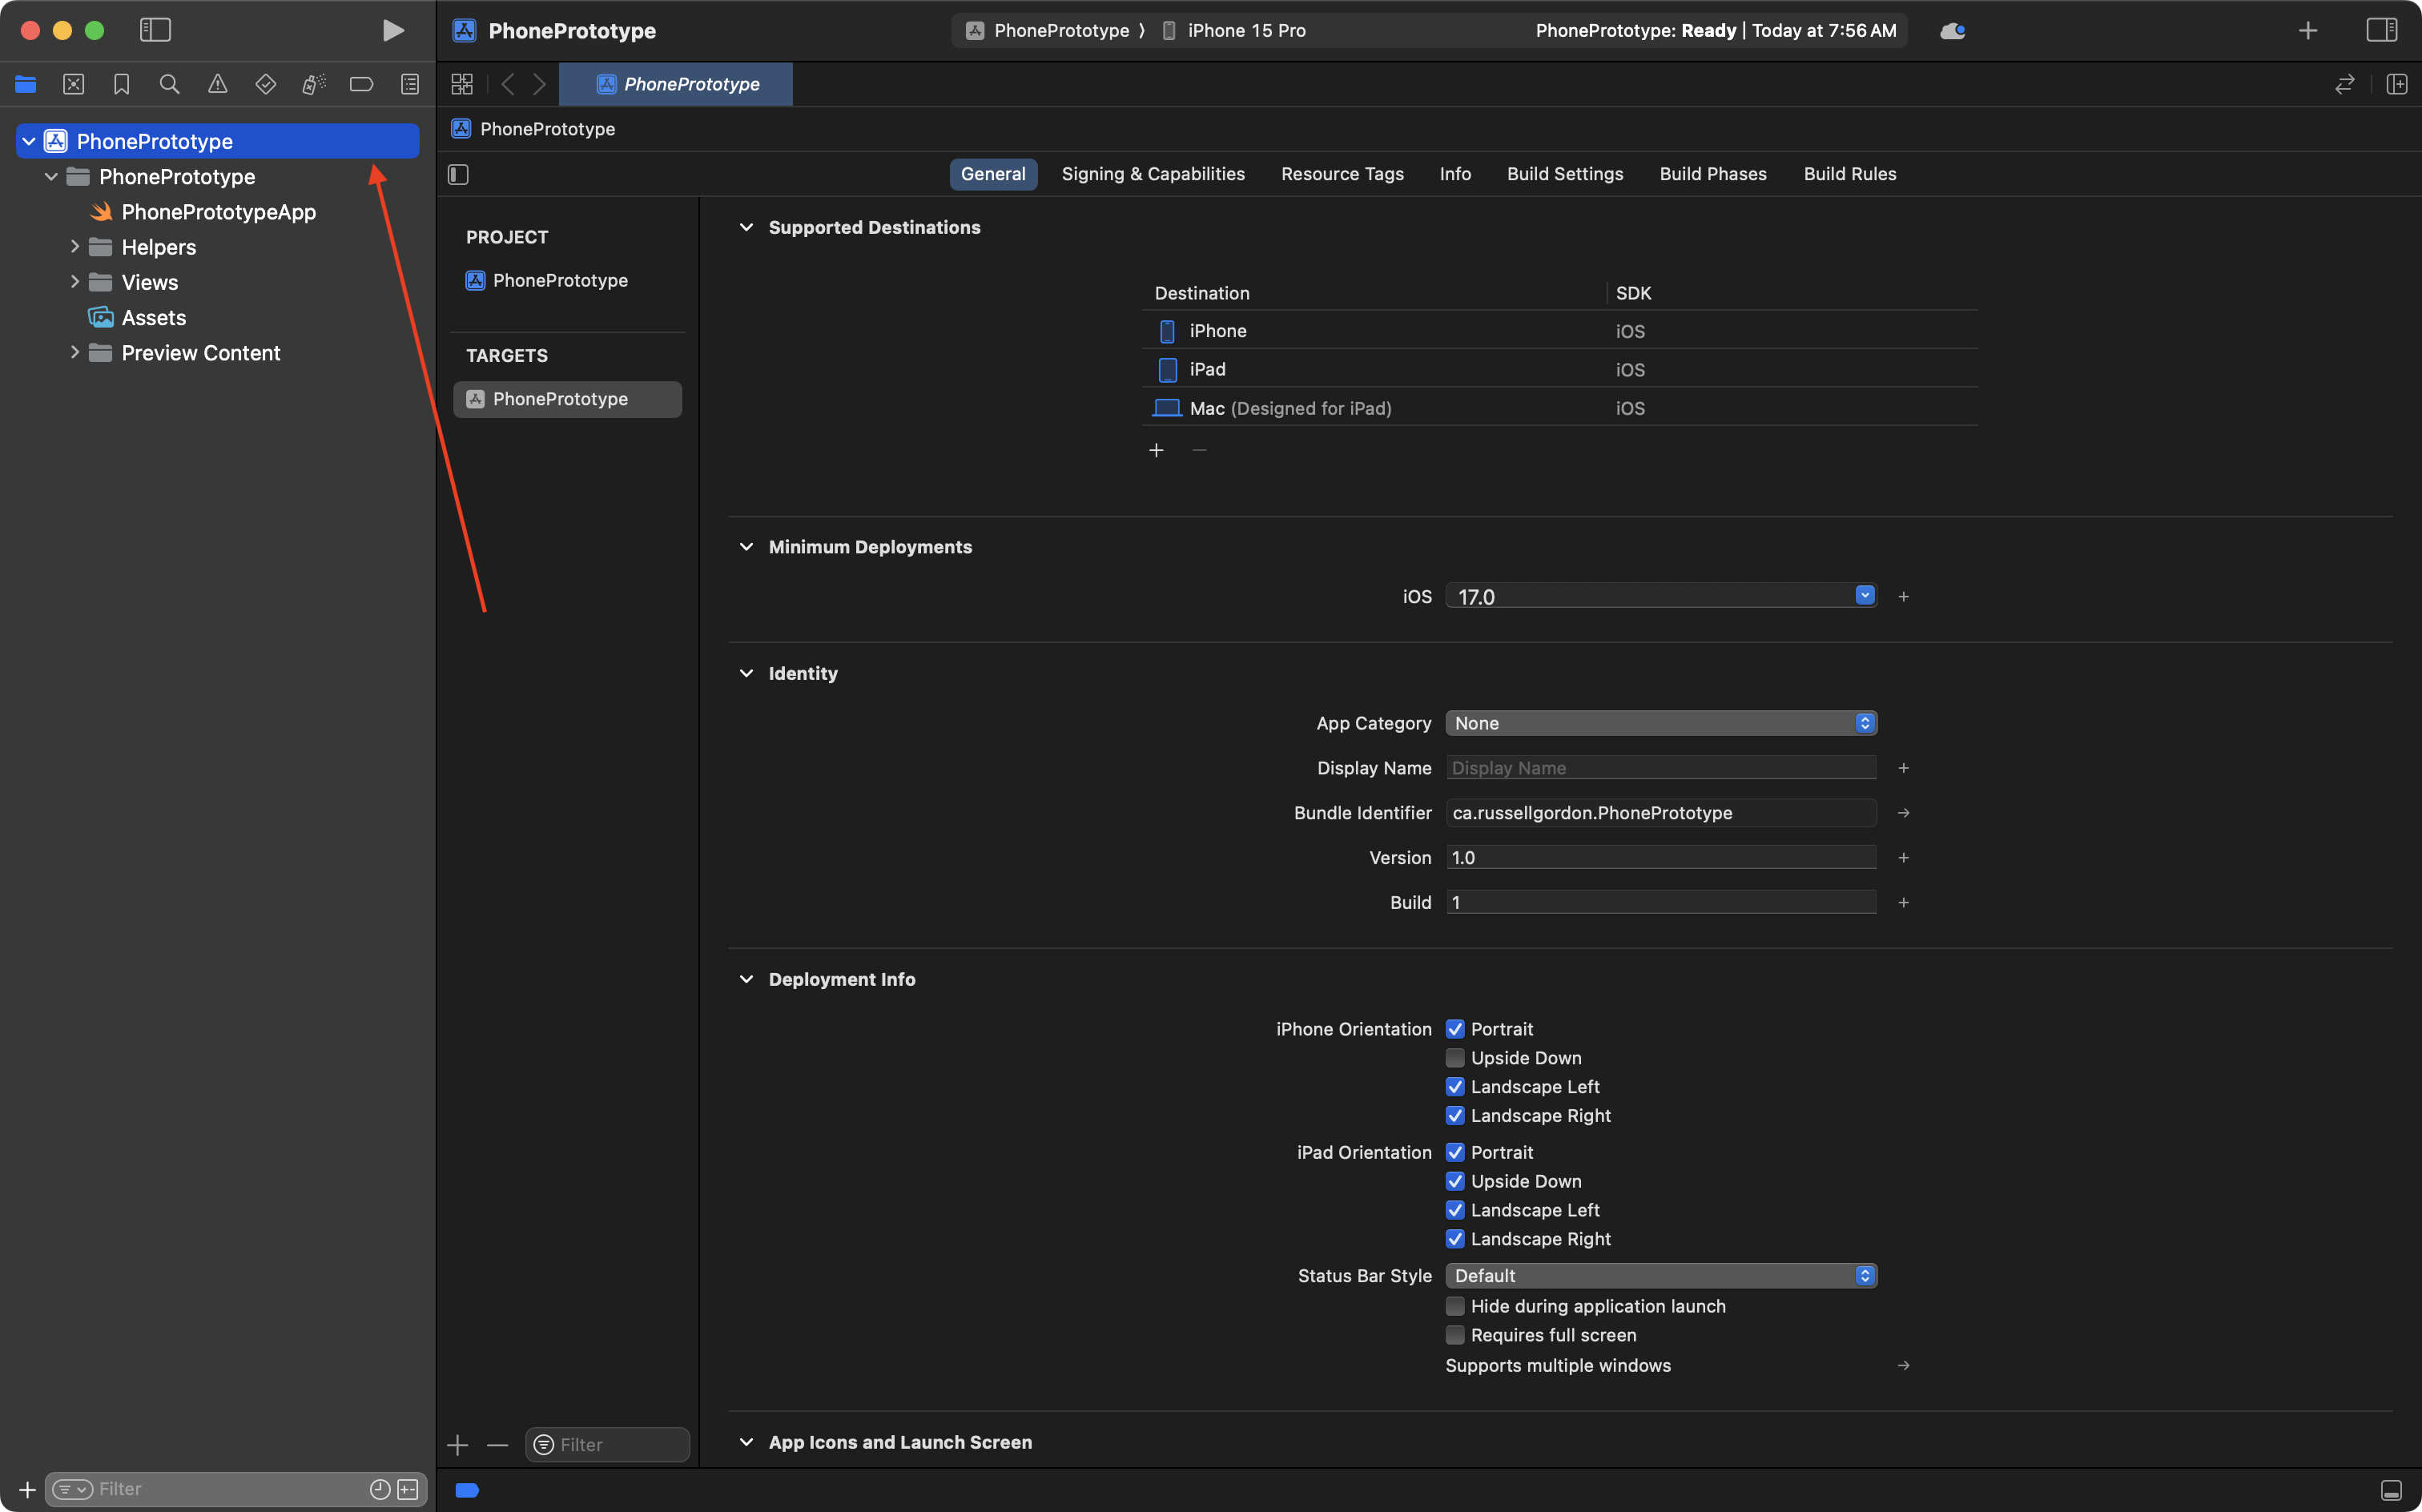
Select the blue PhonePrototype project file:
Then select the Signing & Capabilities tab:
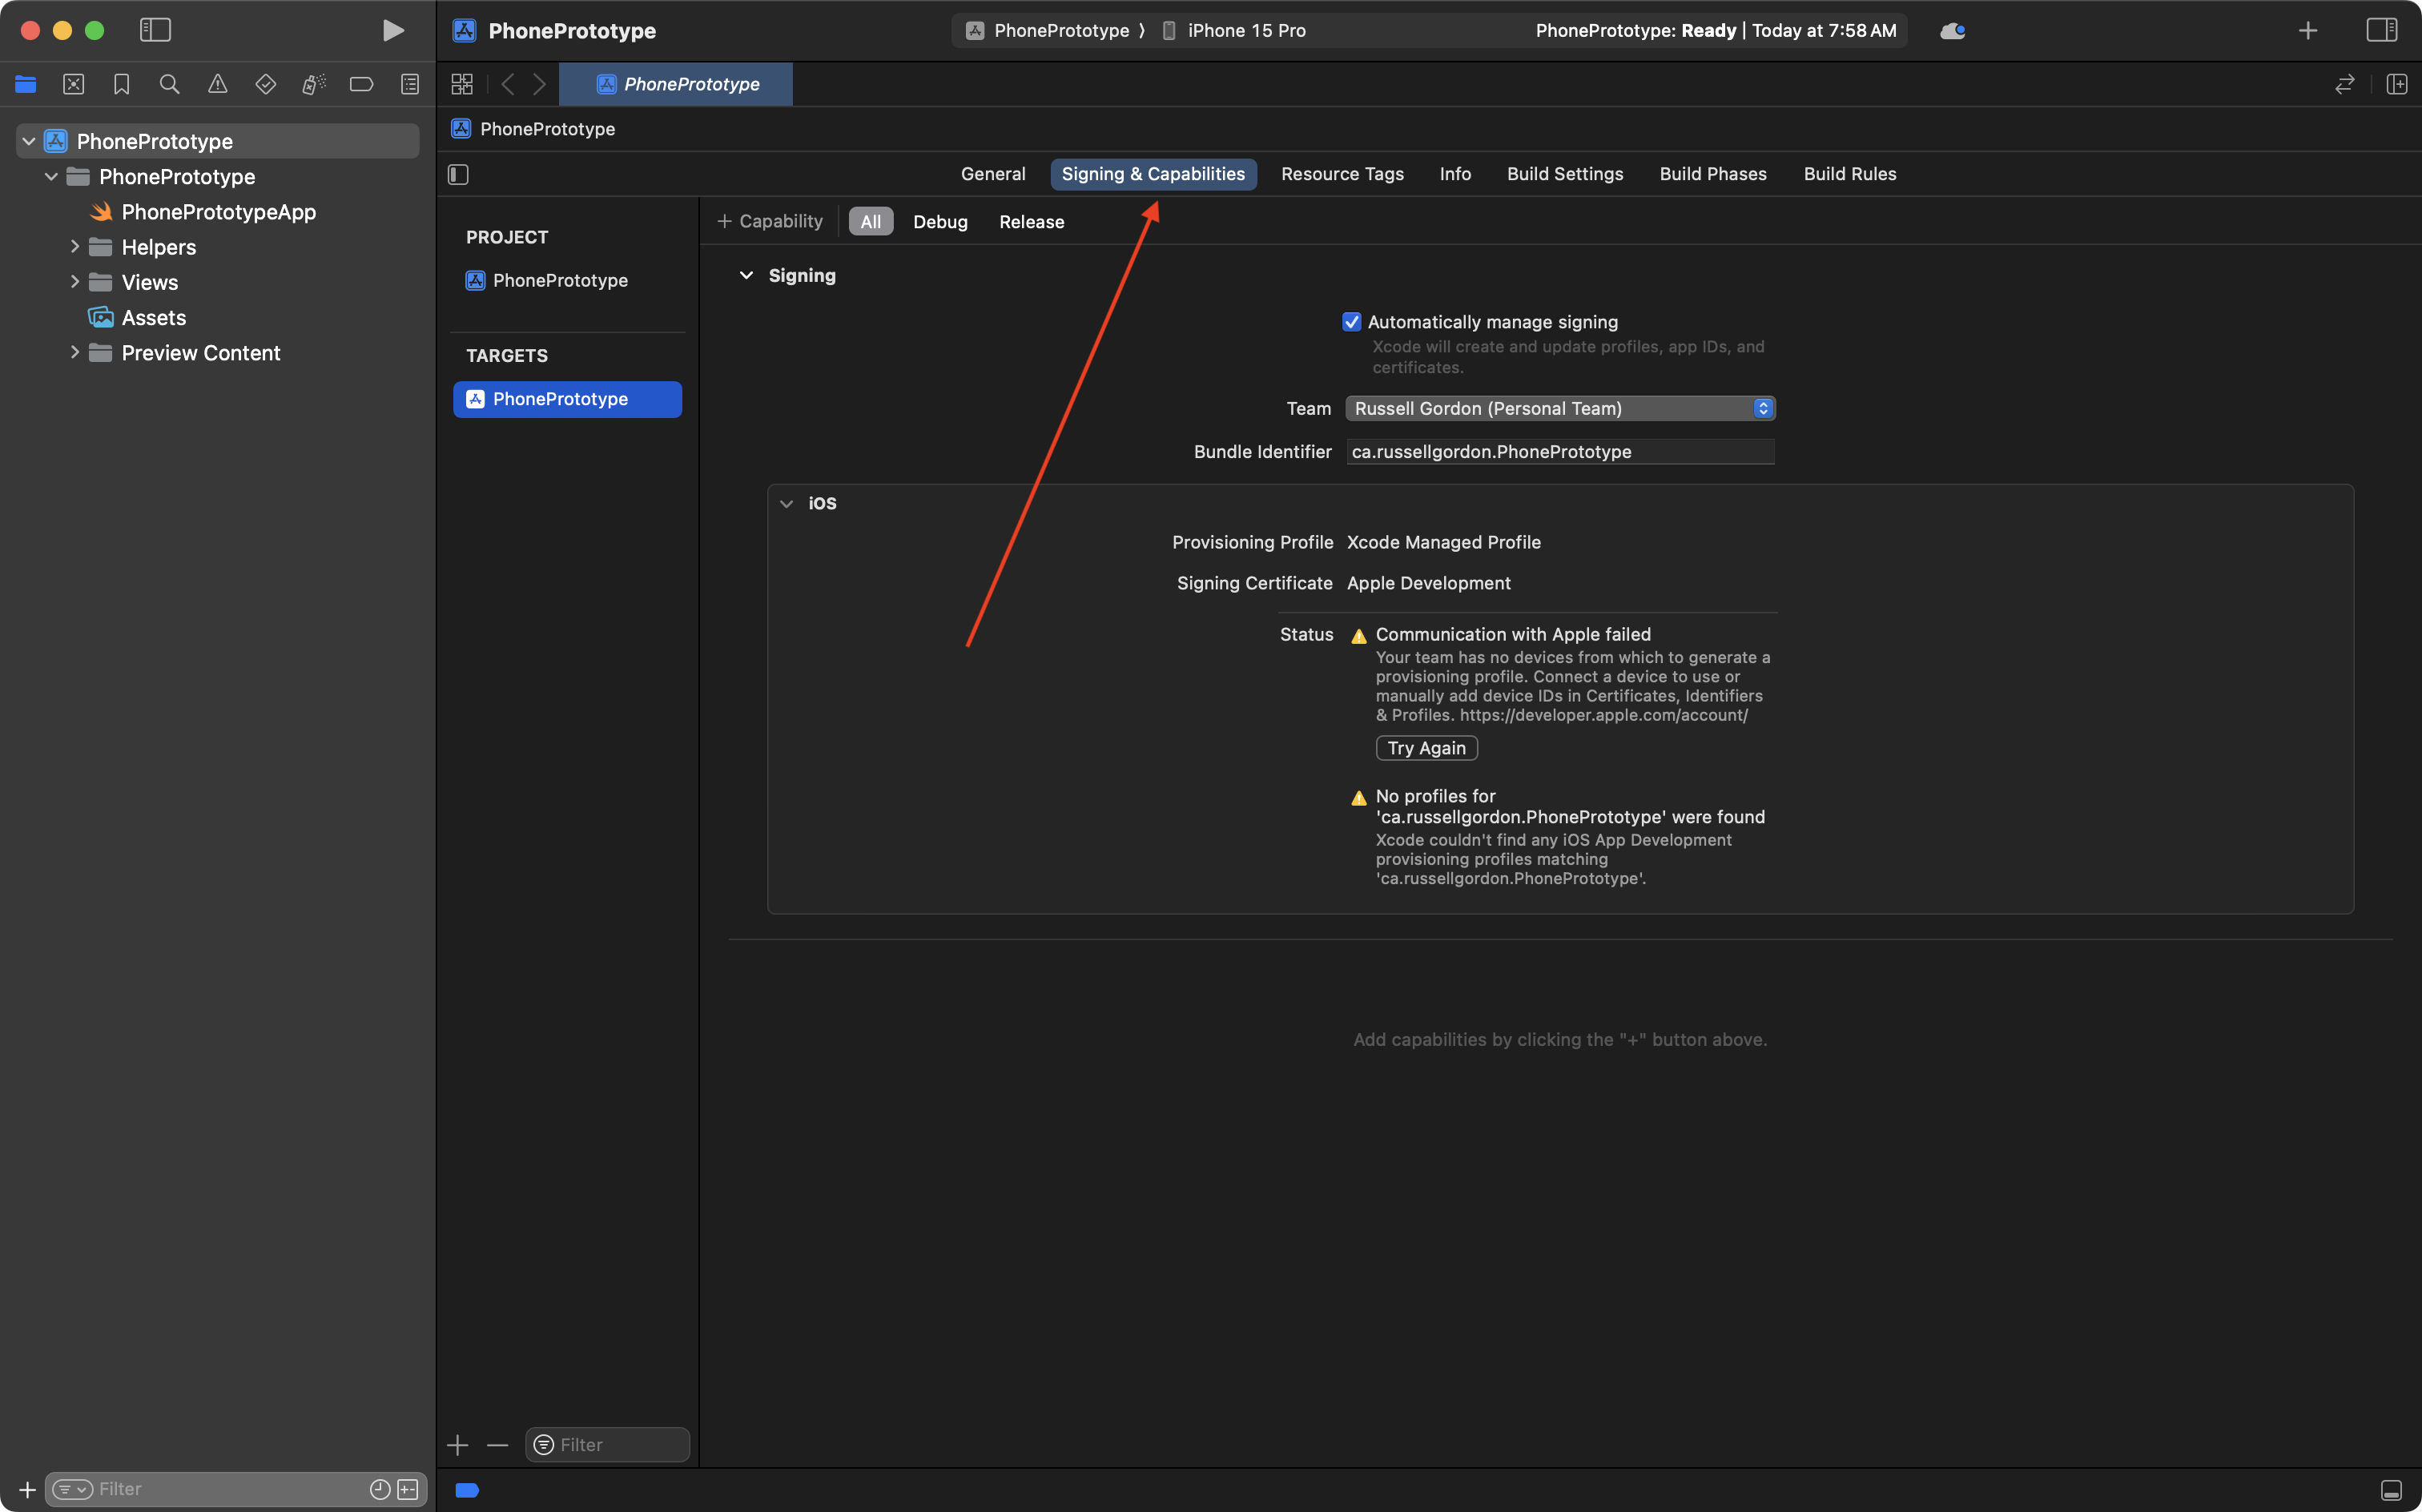
Finally, from the drop-down for Team, select your personal team:
.png)
Now, you should be able to preview and run the project in the Simulator. We will learn how to do this now…
Showing the Preview or Canvas
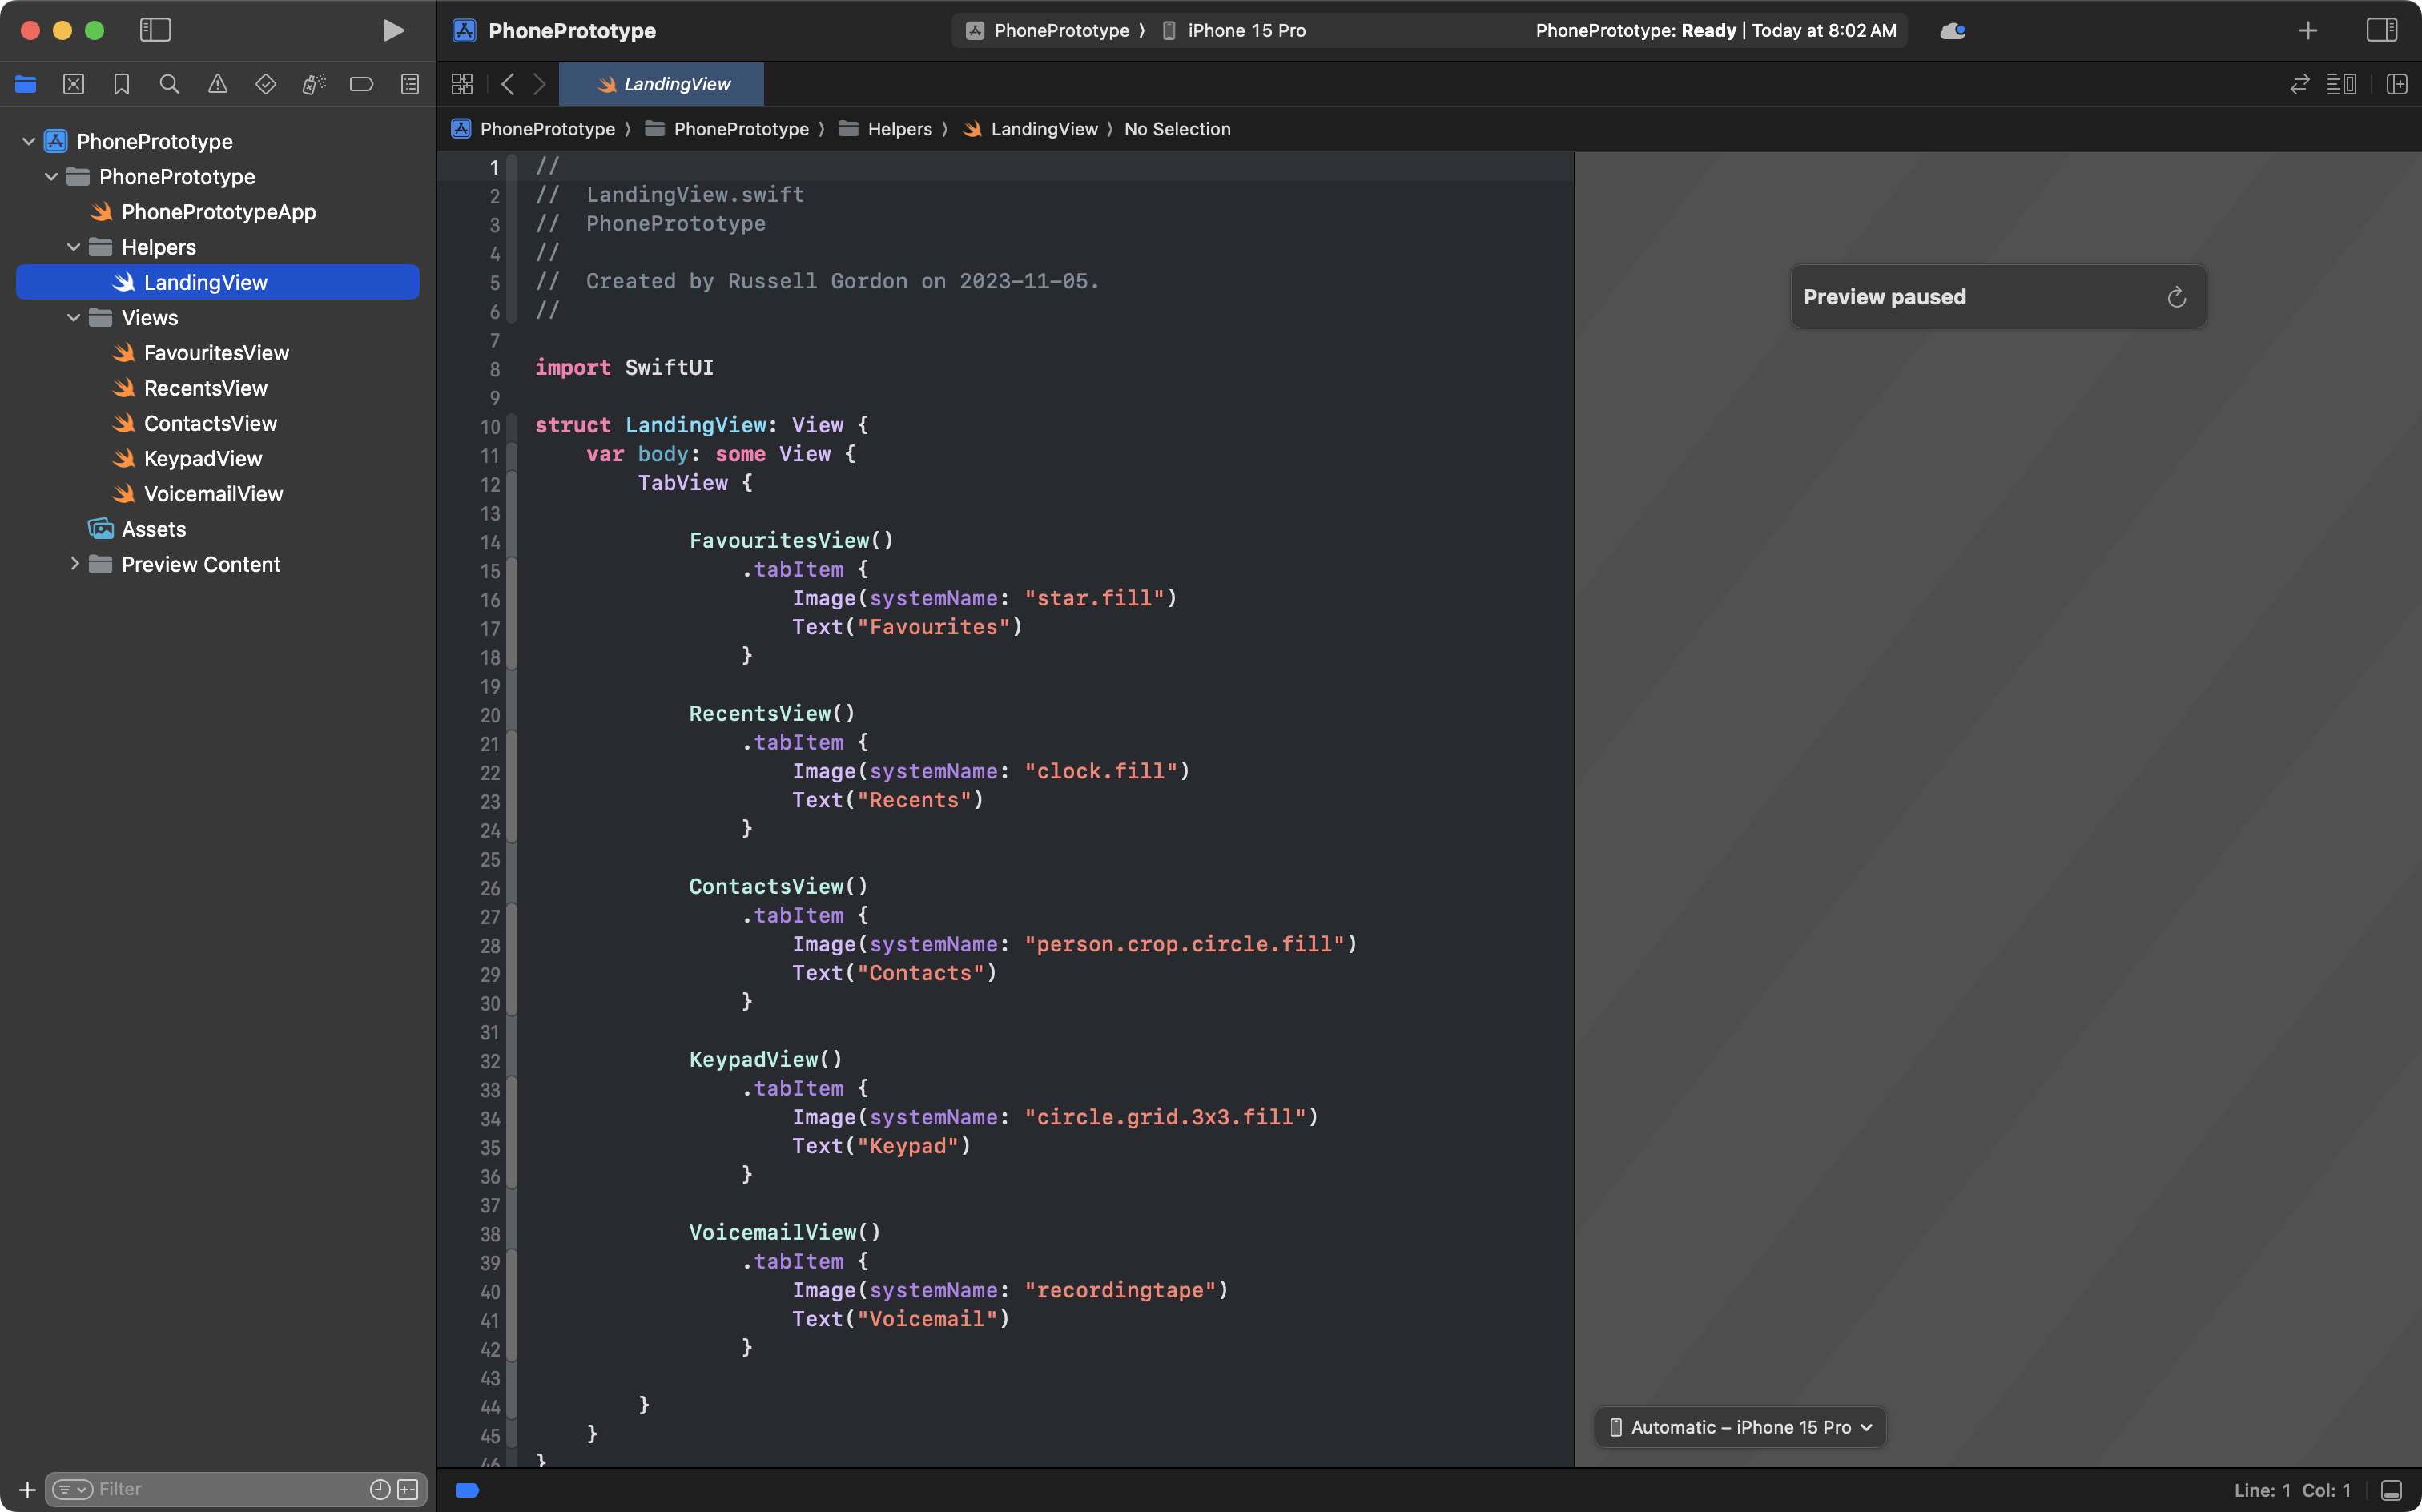
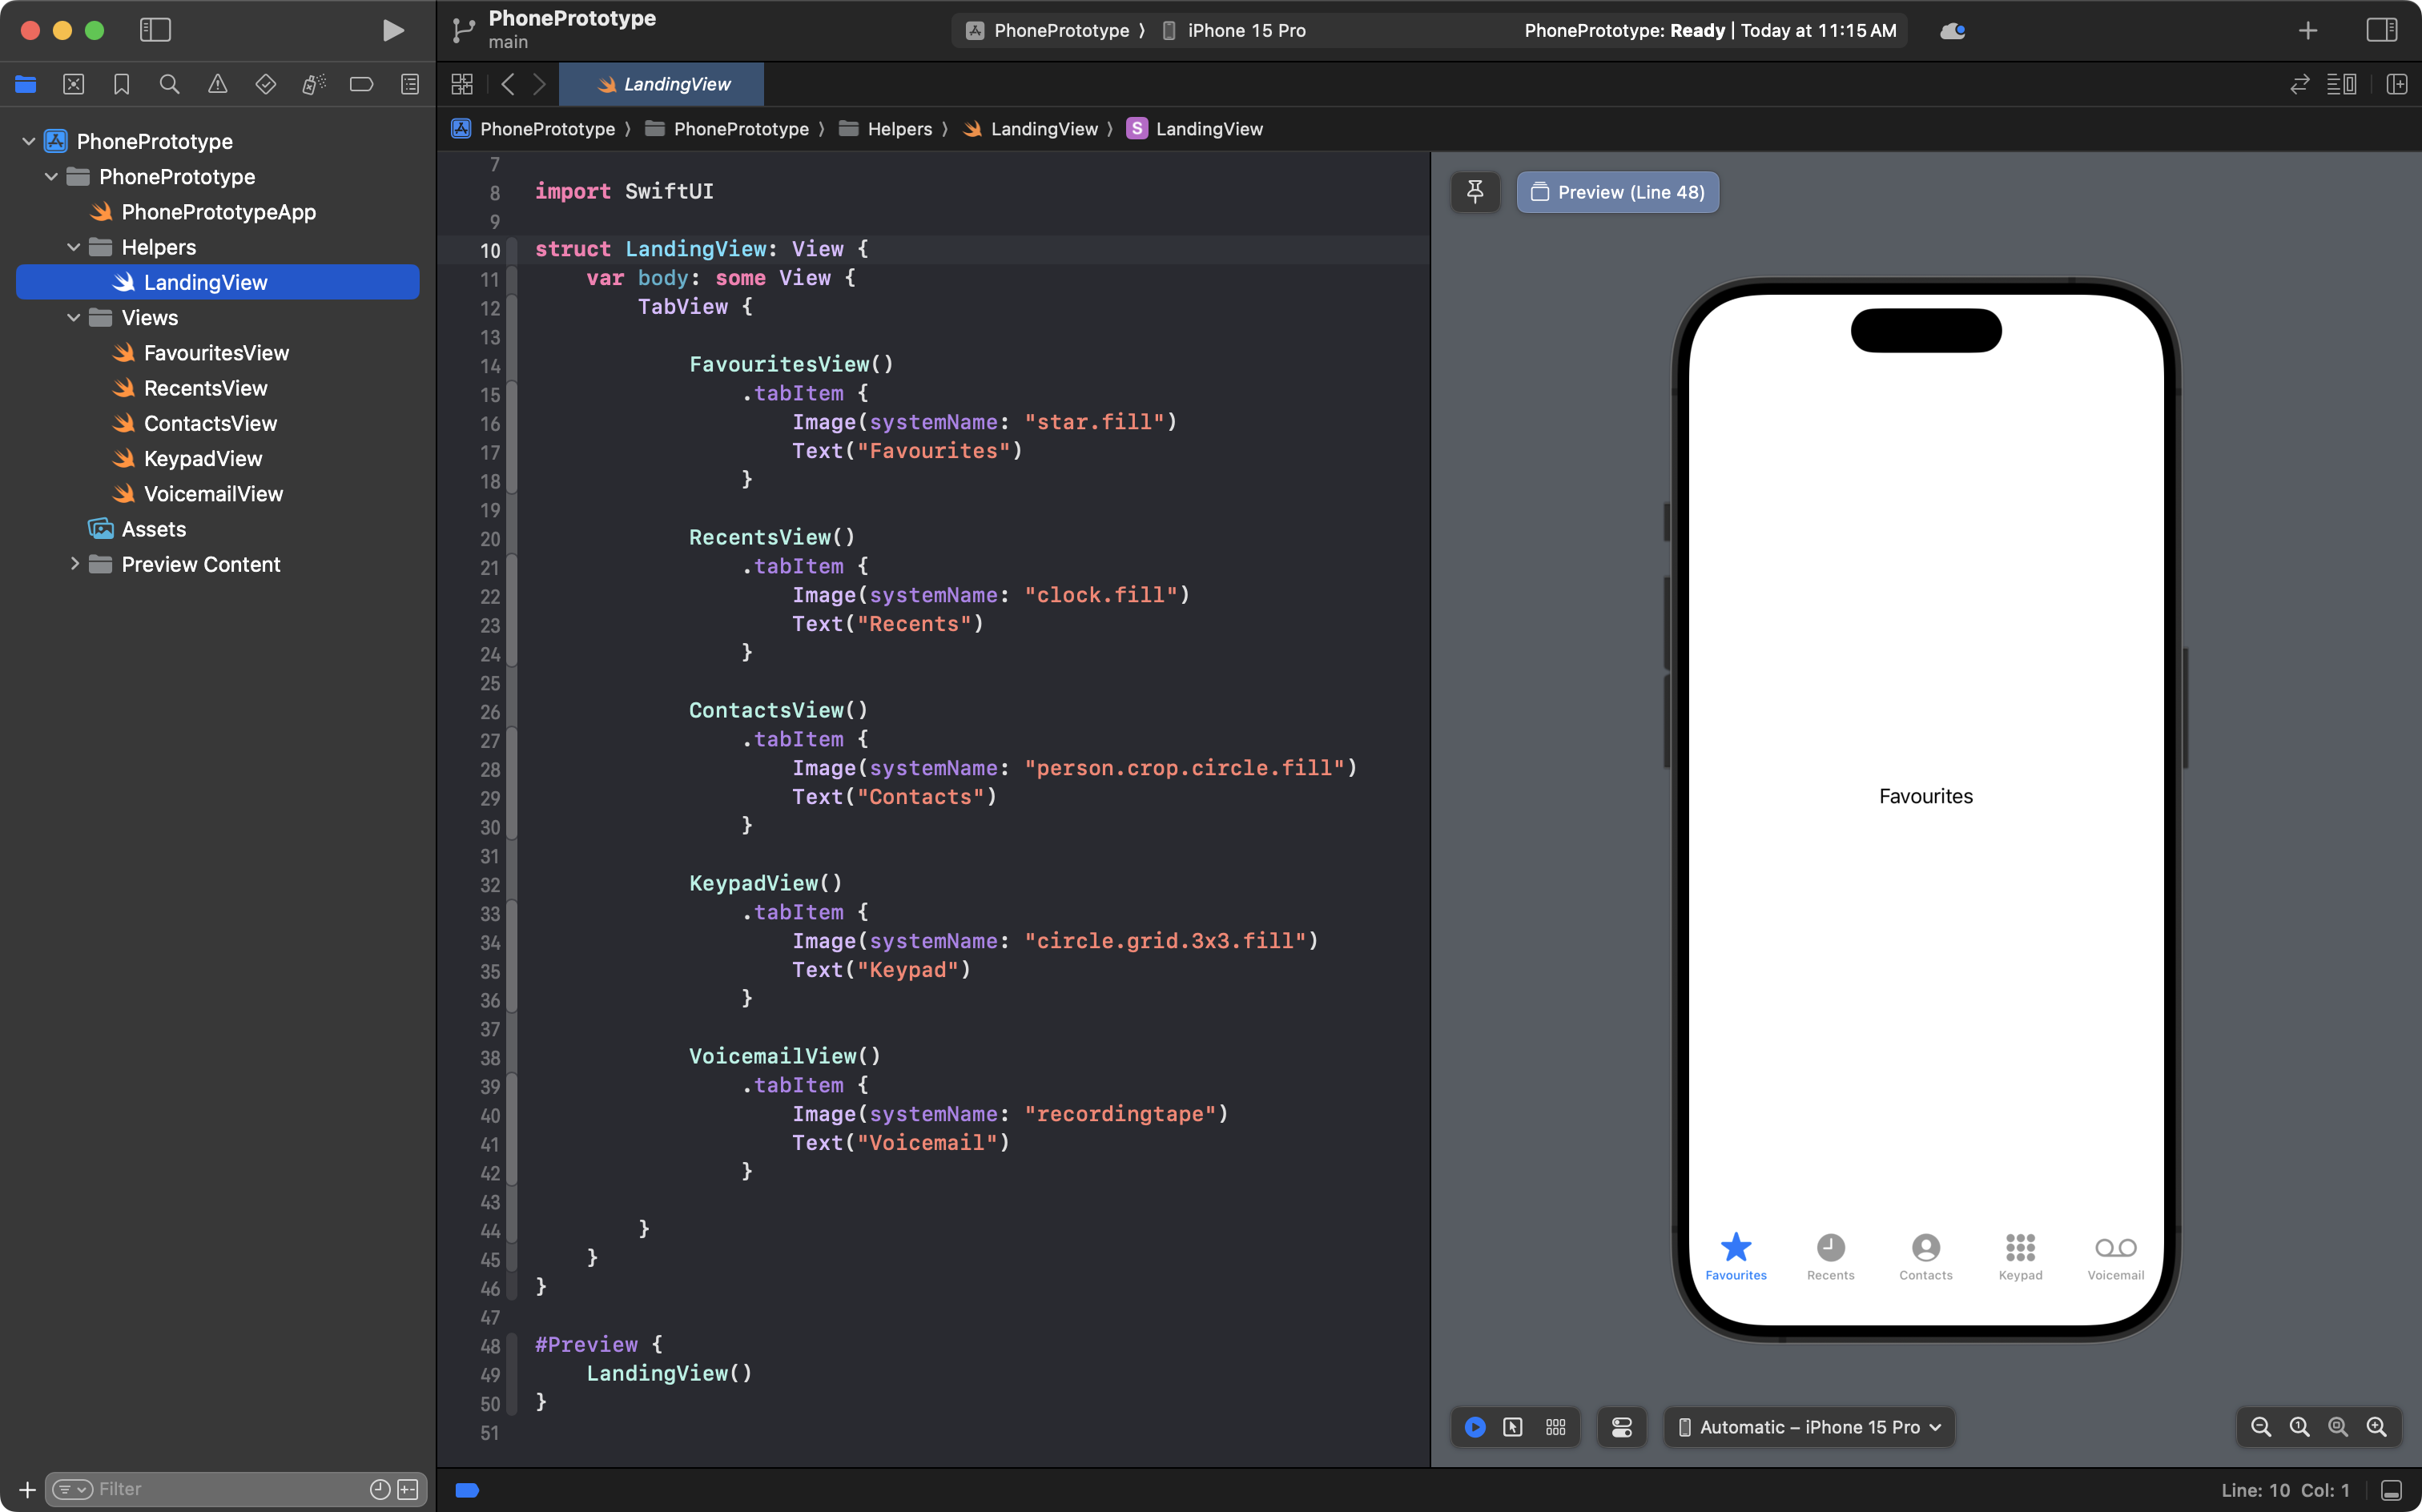
Press Command-1 to be sure you have the Project Navigator open, then expand the Helpers and Views folders, then select the LandingView file. You should see something like this:
If you do not see the Preview section at right, sometimes called the Canvas, press Option-Command-Return on your keyboard, or use the mouse pointer as shown.
The Preview or Canvas area will appear and disappear:

Starting the Preview
The primary purpose of the Preview window is to show just the contents of the single view, or file, you are currently working on.
To start the Preview, click the ↻ icon, or use the Option-Command-P keyboard shortcut:

After about 10 seconds (or a few minutes if you have an older computer) you will see the preview appear:
TIP
If you know you have an older computer, start the Preview window in an Xcode project as soon as you arrive to class (or a few minutes before you want to start coding).
Once the Preview window has loaded the first time, updates after changing code will appear relatively quickly.
Using the Preview
As mentioned above, the Preview window shows a single view or file at a time.
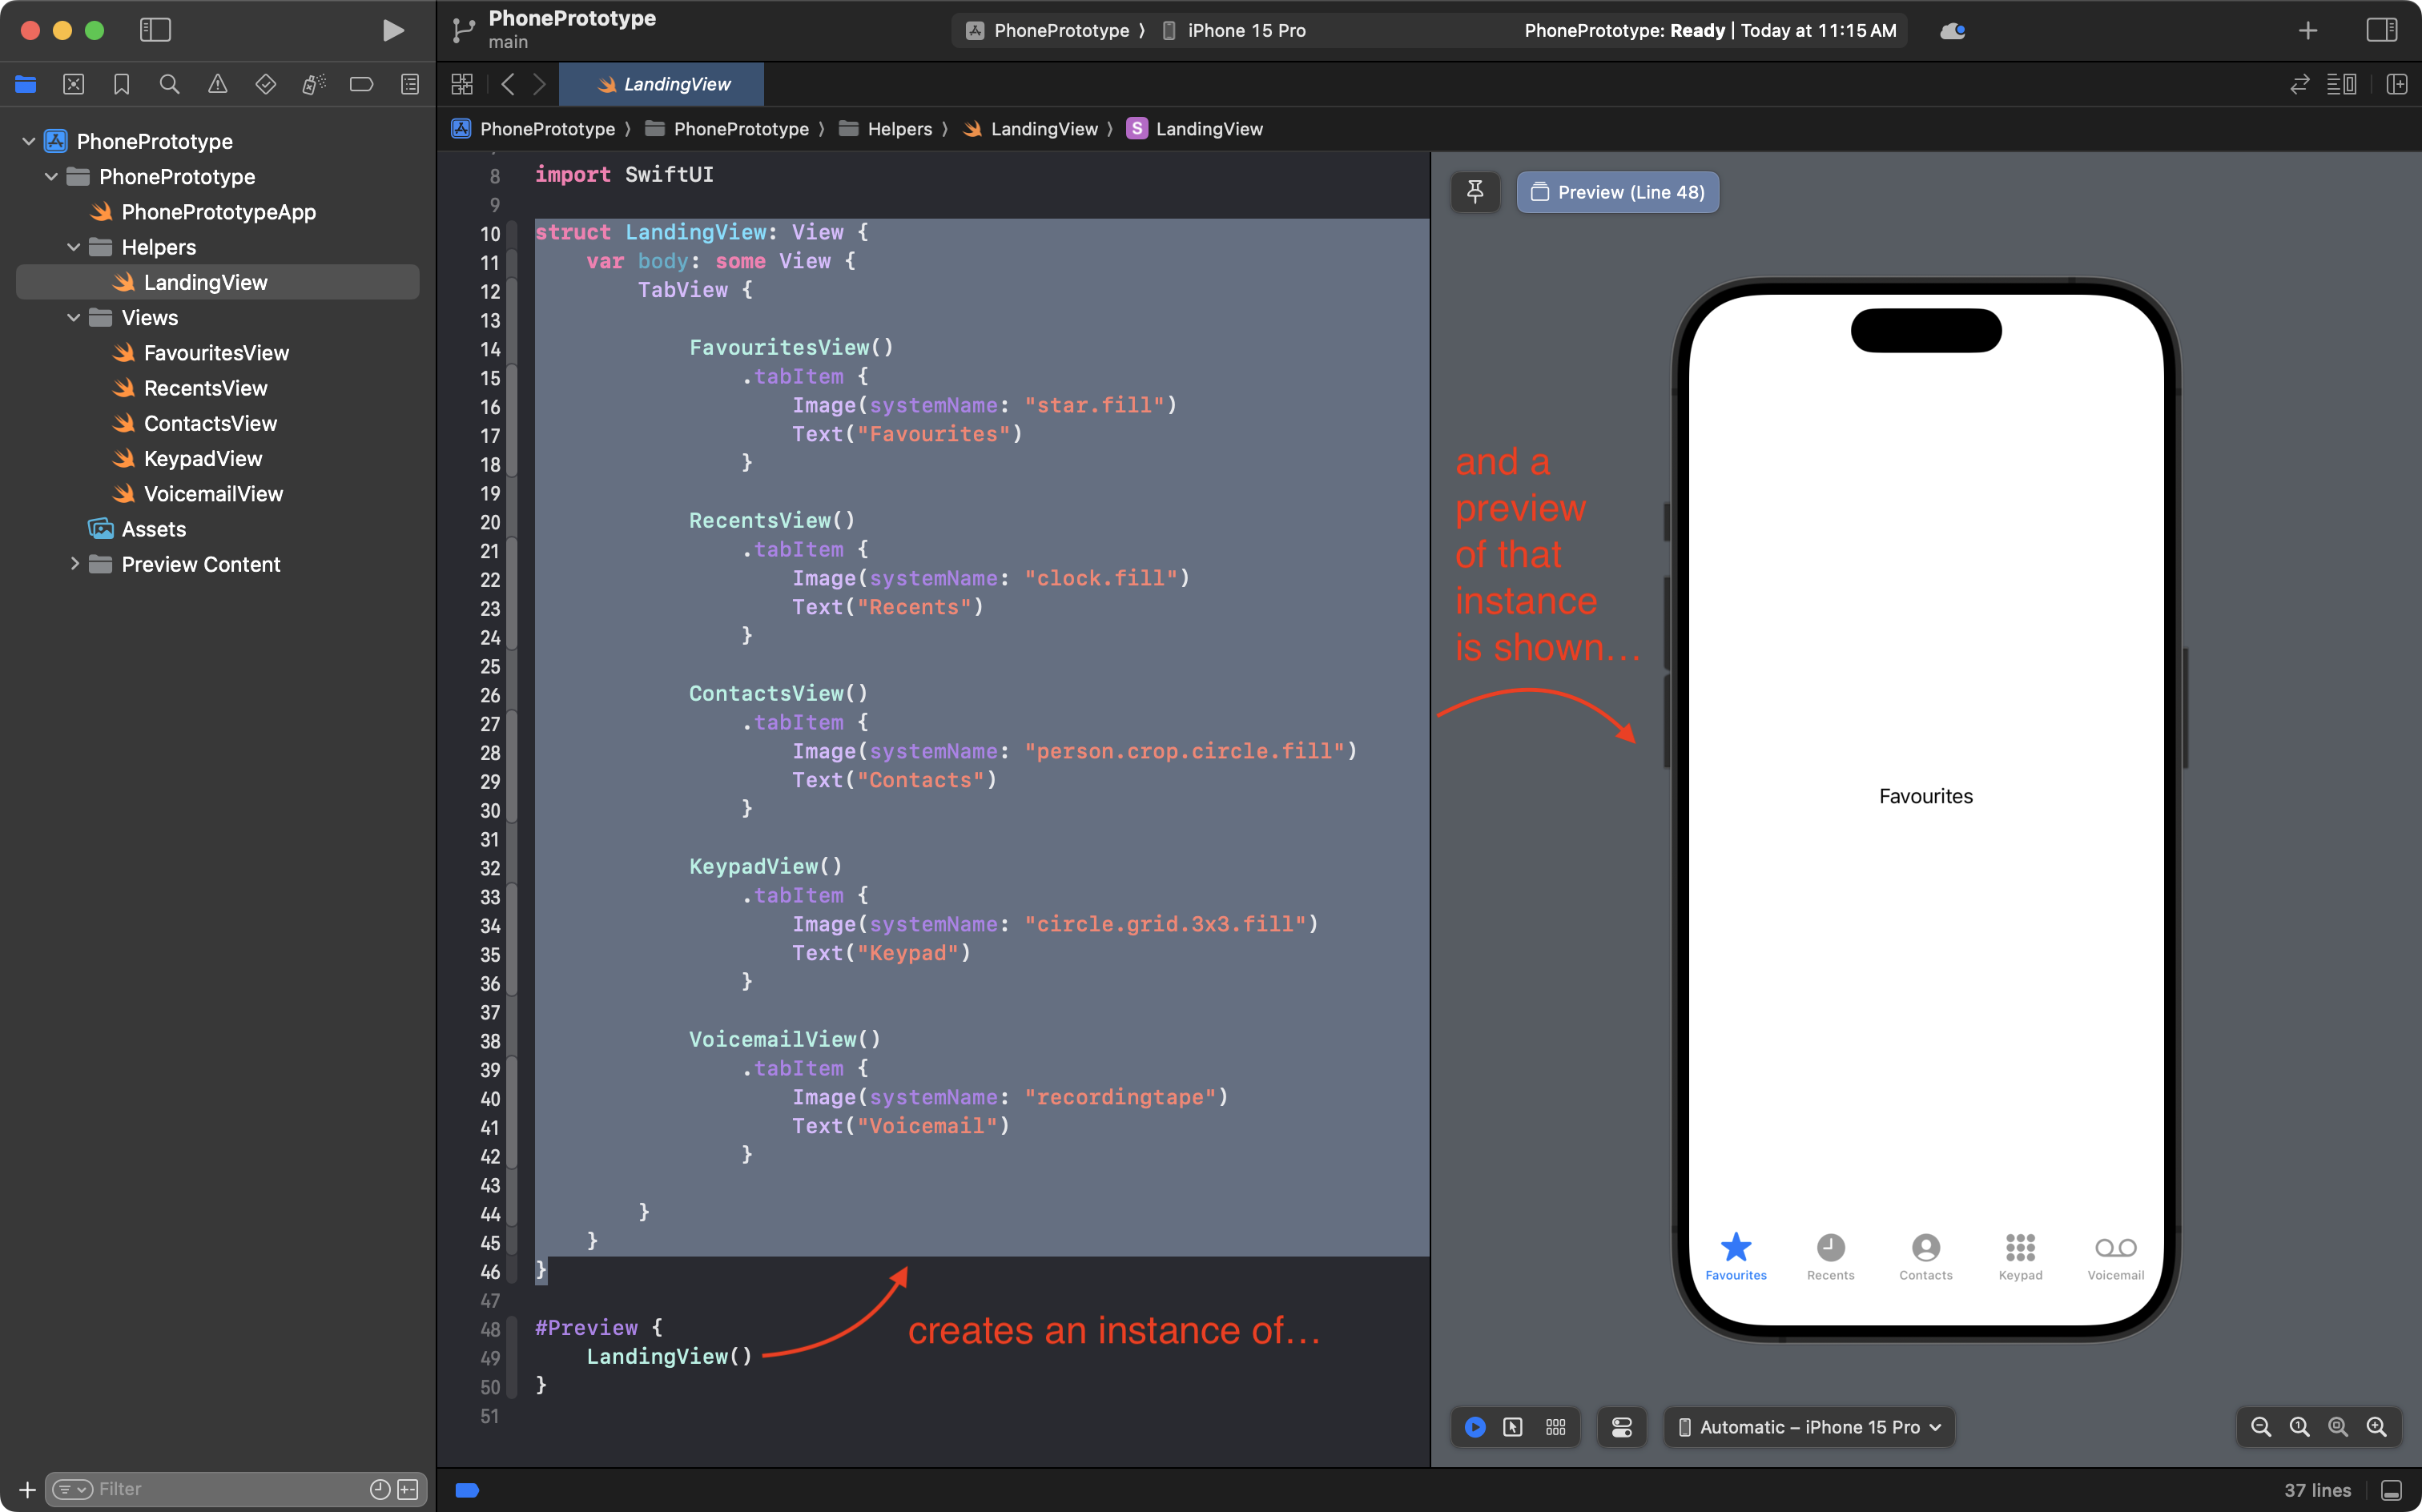
It is code like the following that creates the preview:
#Preview {
    LandingView()
}
In this case, the preview creates an instance of the LandingView structure.
As you can see, the LandingView structure contains only a TabView stucture:
struct LandingView: View {
    var body: some View {
        TabView {

            FavouritesView()
                .tabItem {
                    Image(systemName: "star.fill")
                    Text("Favourites")
                }

            RecentsView()
                .tabItem {
                    Image(systemName: "clock.fill")
                    Text("Recents")
                }

            ContactsView()
                .tabItem {
                    Image(systemName: "person.crop.circle.fill")
                    Text("Contacts")
                }

            KeypadView()
                .tabItem {
                    Image(systemName: "circle.grid.3x3.fill")
                    Text("Keypad")
                }

            VoicemailView()
                .tabItem {
                    Image(systemName: "recordingtape")
                    Text("Voicemail")
                }

        }
    }
}
Here is an illustration of the flow:
Previews vs. Simulator
If we click through the different views of the app, we can see each file in turn appear in the Previews area:

This is fine if we really do just want to see each view on it’s own.
What if, however, we want to test the app as a whole?
In that case, we can run the app in the full Simulator.
Running an app in the Simulator
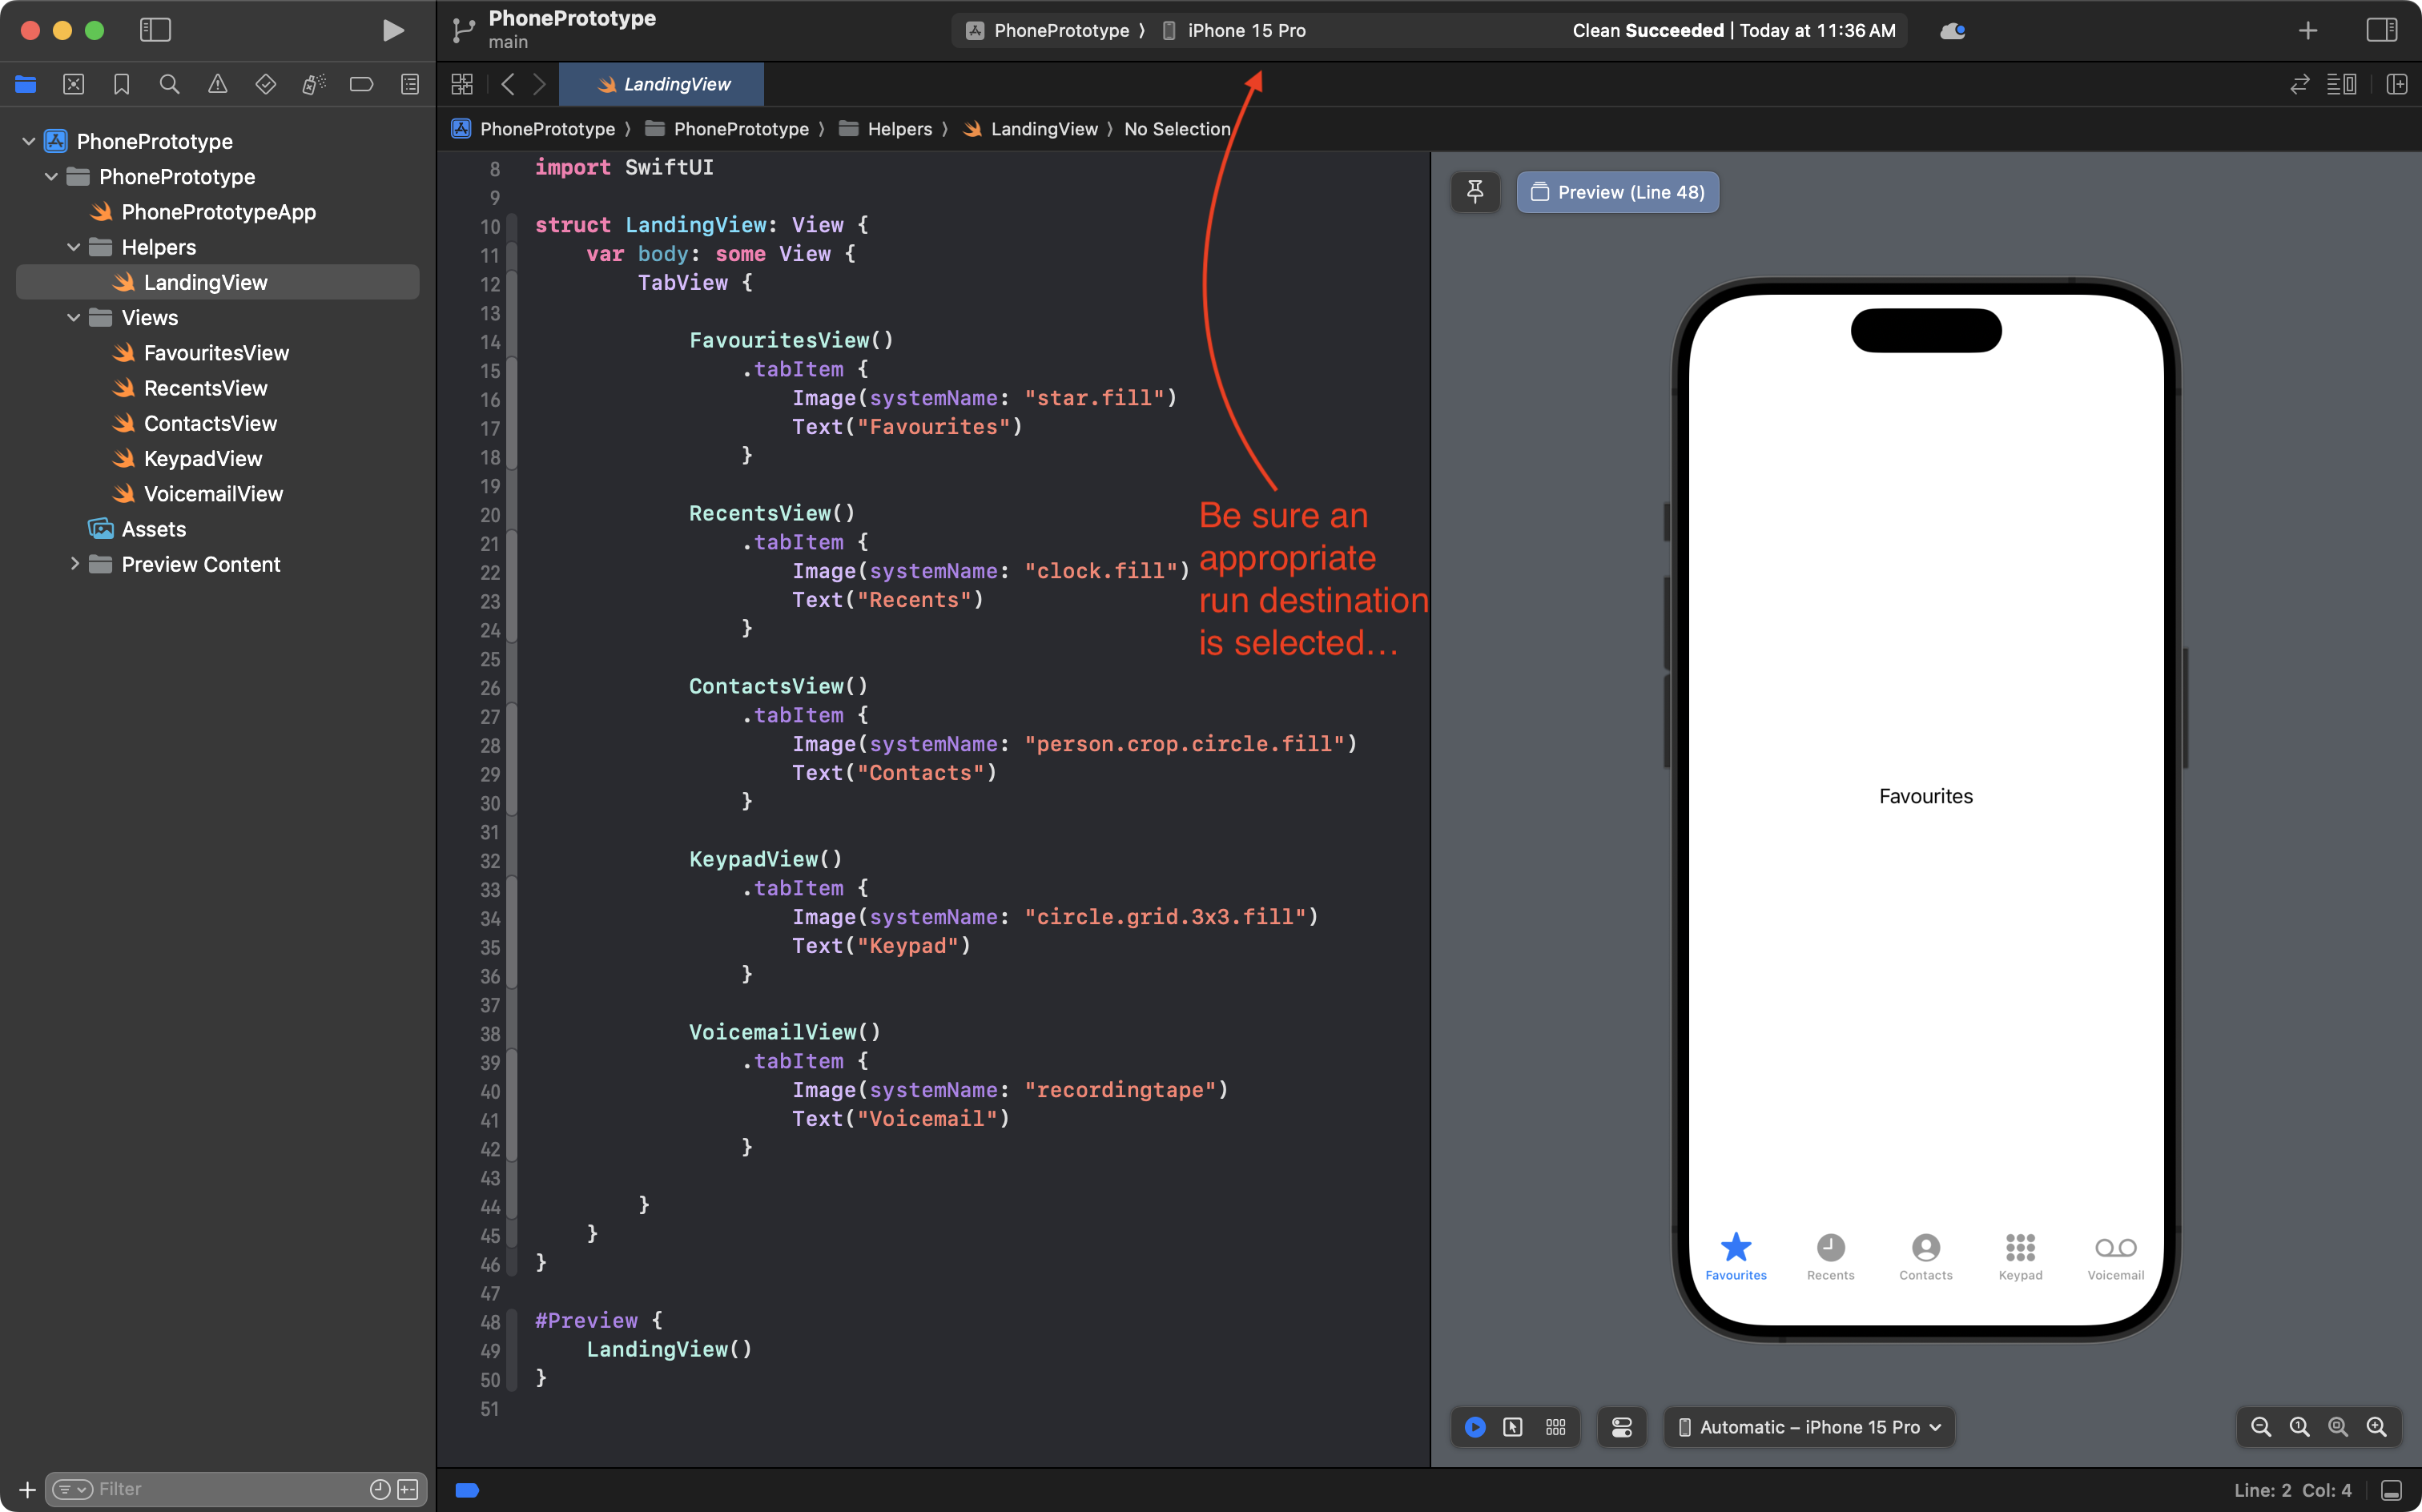
To run an app in the Simulator, first check that you have an appropriate run destination selected. In this case, the app will run within the iPhone 15 Pro simulator:
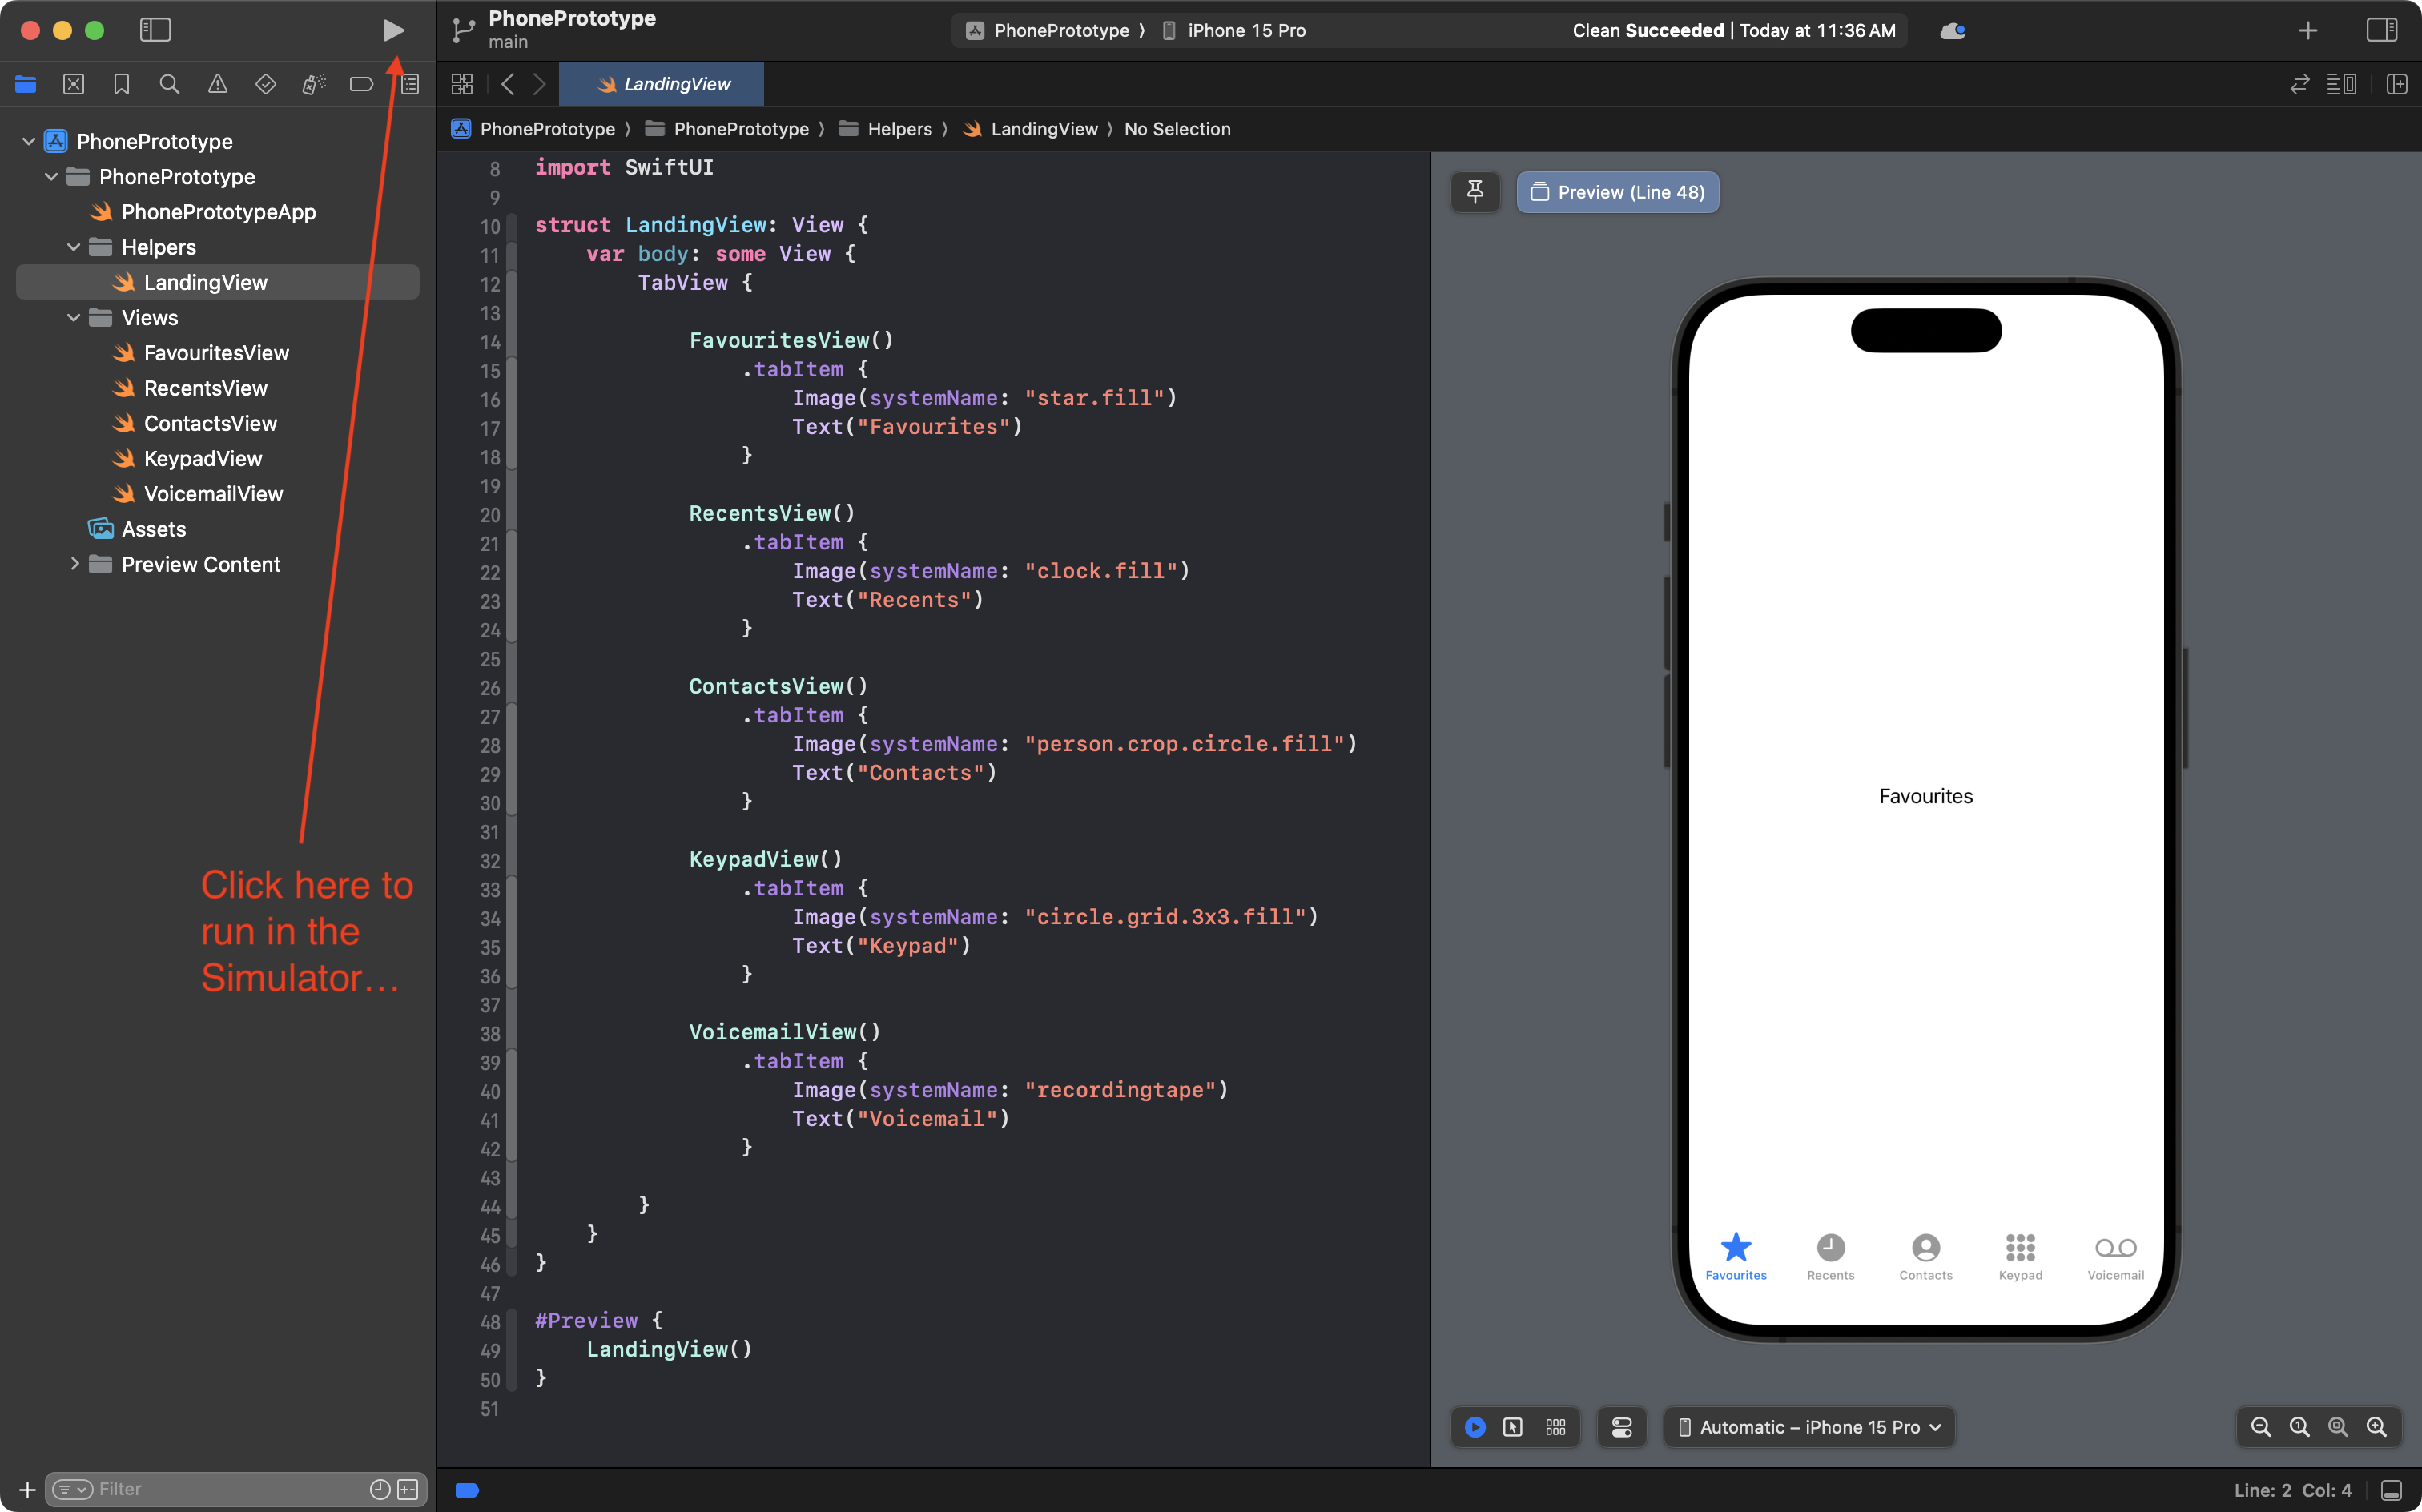
Then to run the app in the full Simulator, press Command-R or click the ▶️ icon in the Xcode toolbar:
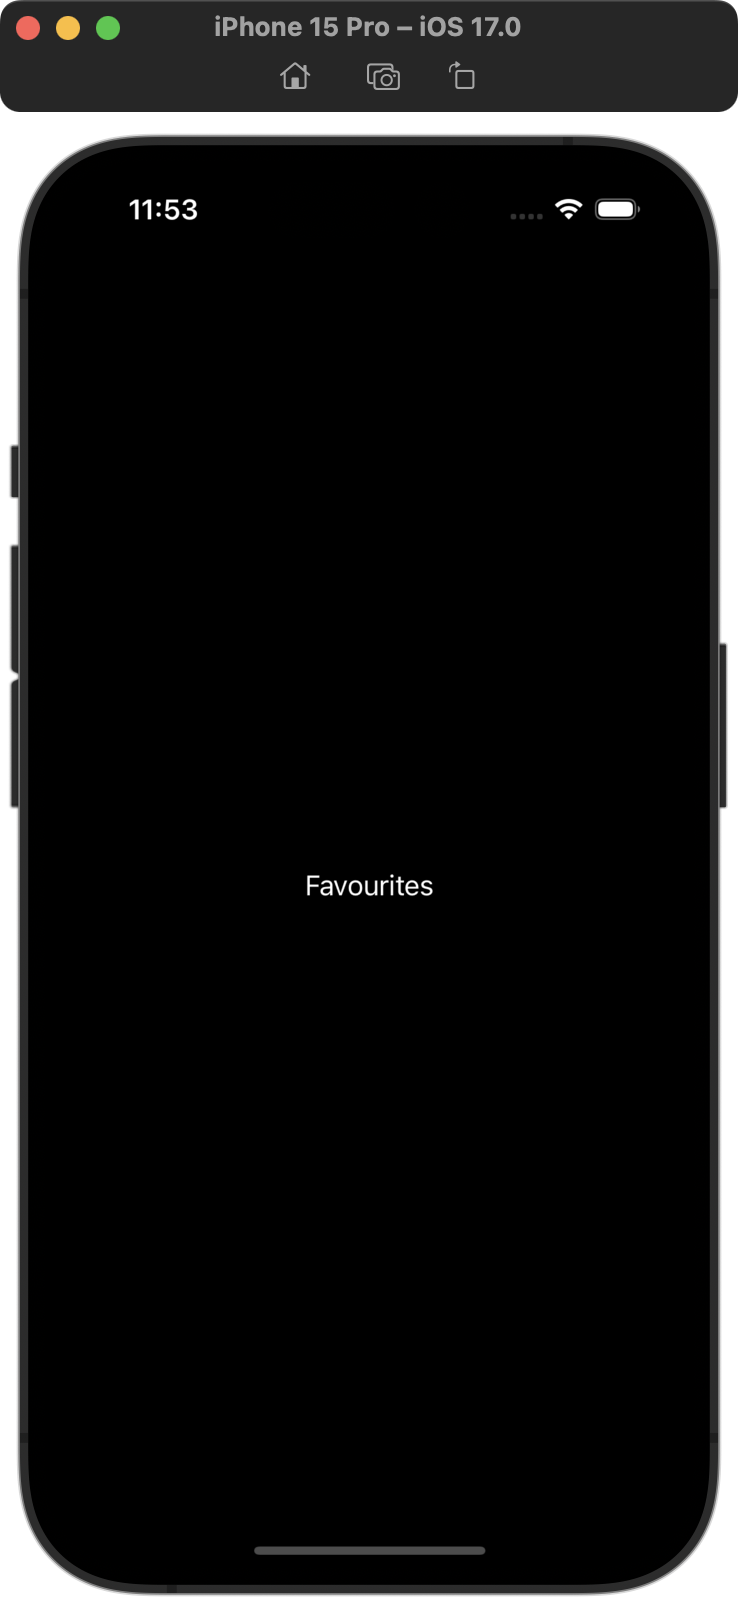
After a moment, you will see the app appear in the Simulator:
TIP
If you have an older computer, starting the Simulator will take some time.
However, after the Simulator is loaded for the first time, if you keep it running, the next time you run your code, the new version of your app will appear in the Simulator much more quickly.
It is also possible to run apps directly on your actual phone, and this process is much faster. A tutorial explaining how to do that will be provided soon.
Note that the app is only showing FavouritesView though, and not the full tab view.
Why is that? Let’s investigate…
App entry point
In the Project navigator select the PhonePrototypeApp file:
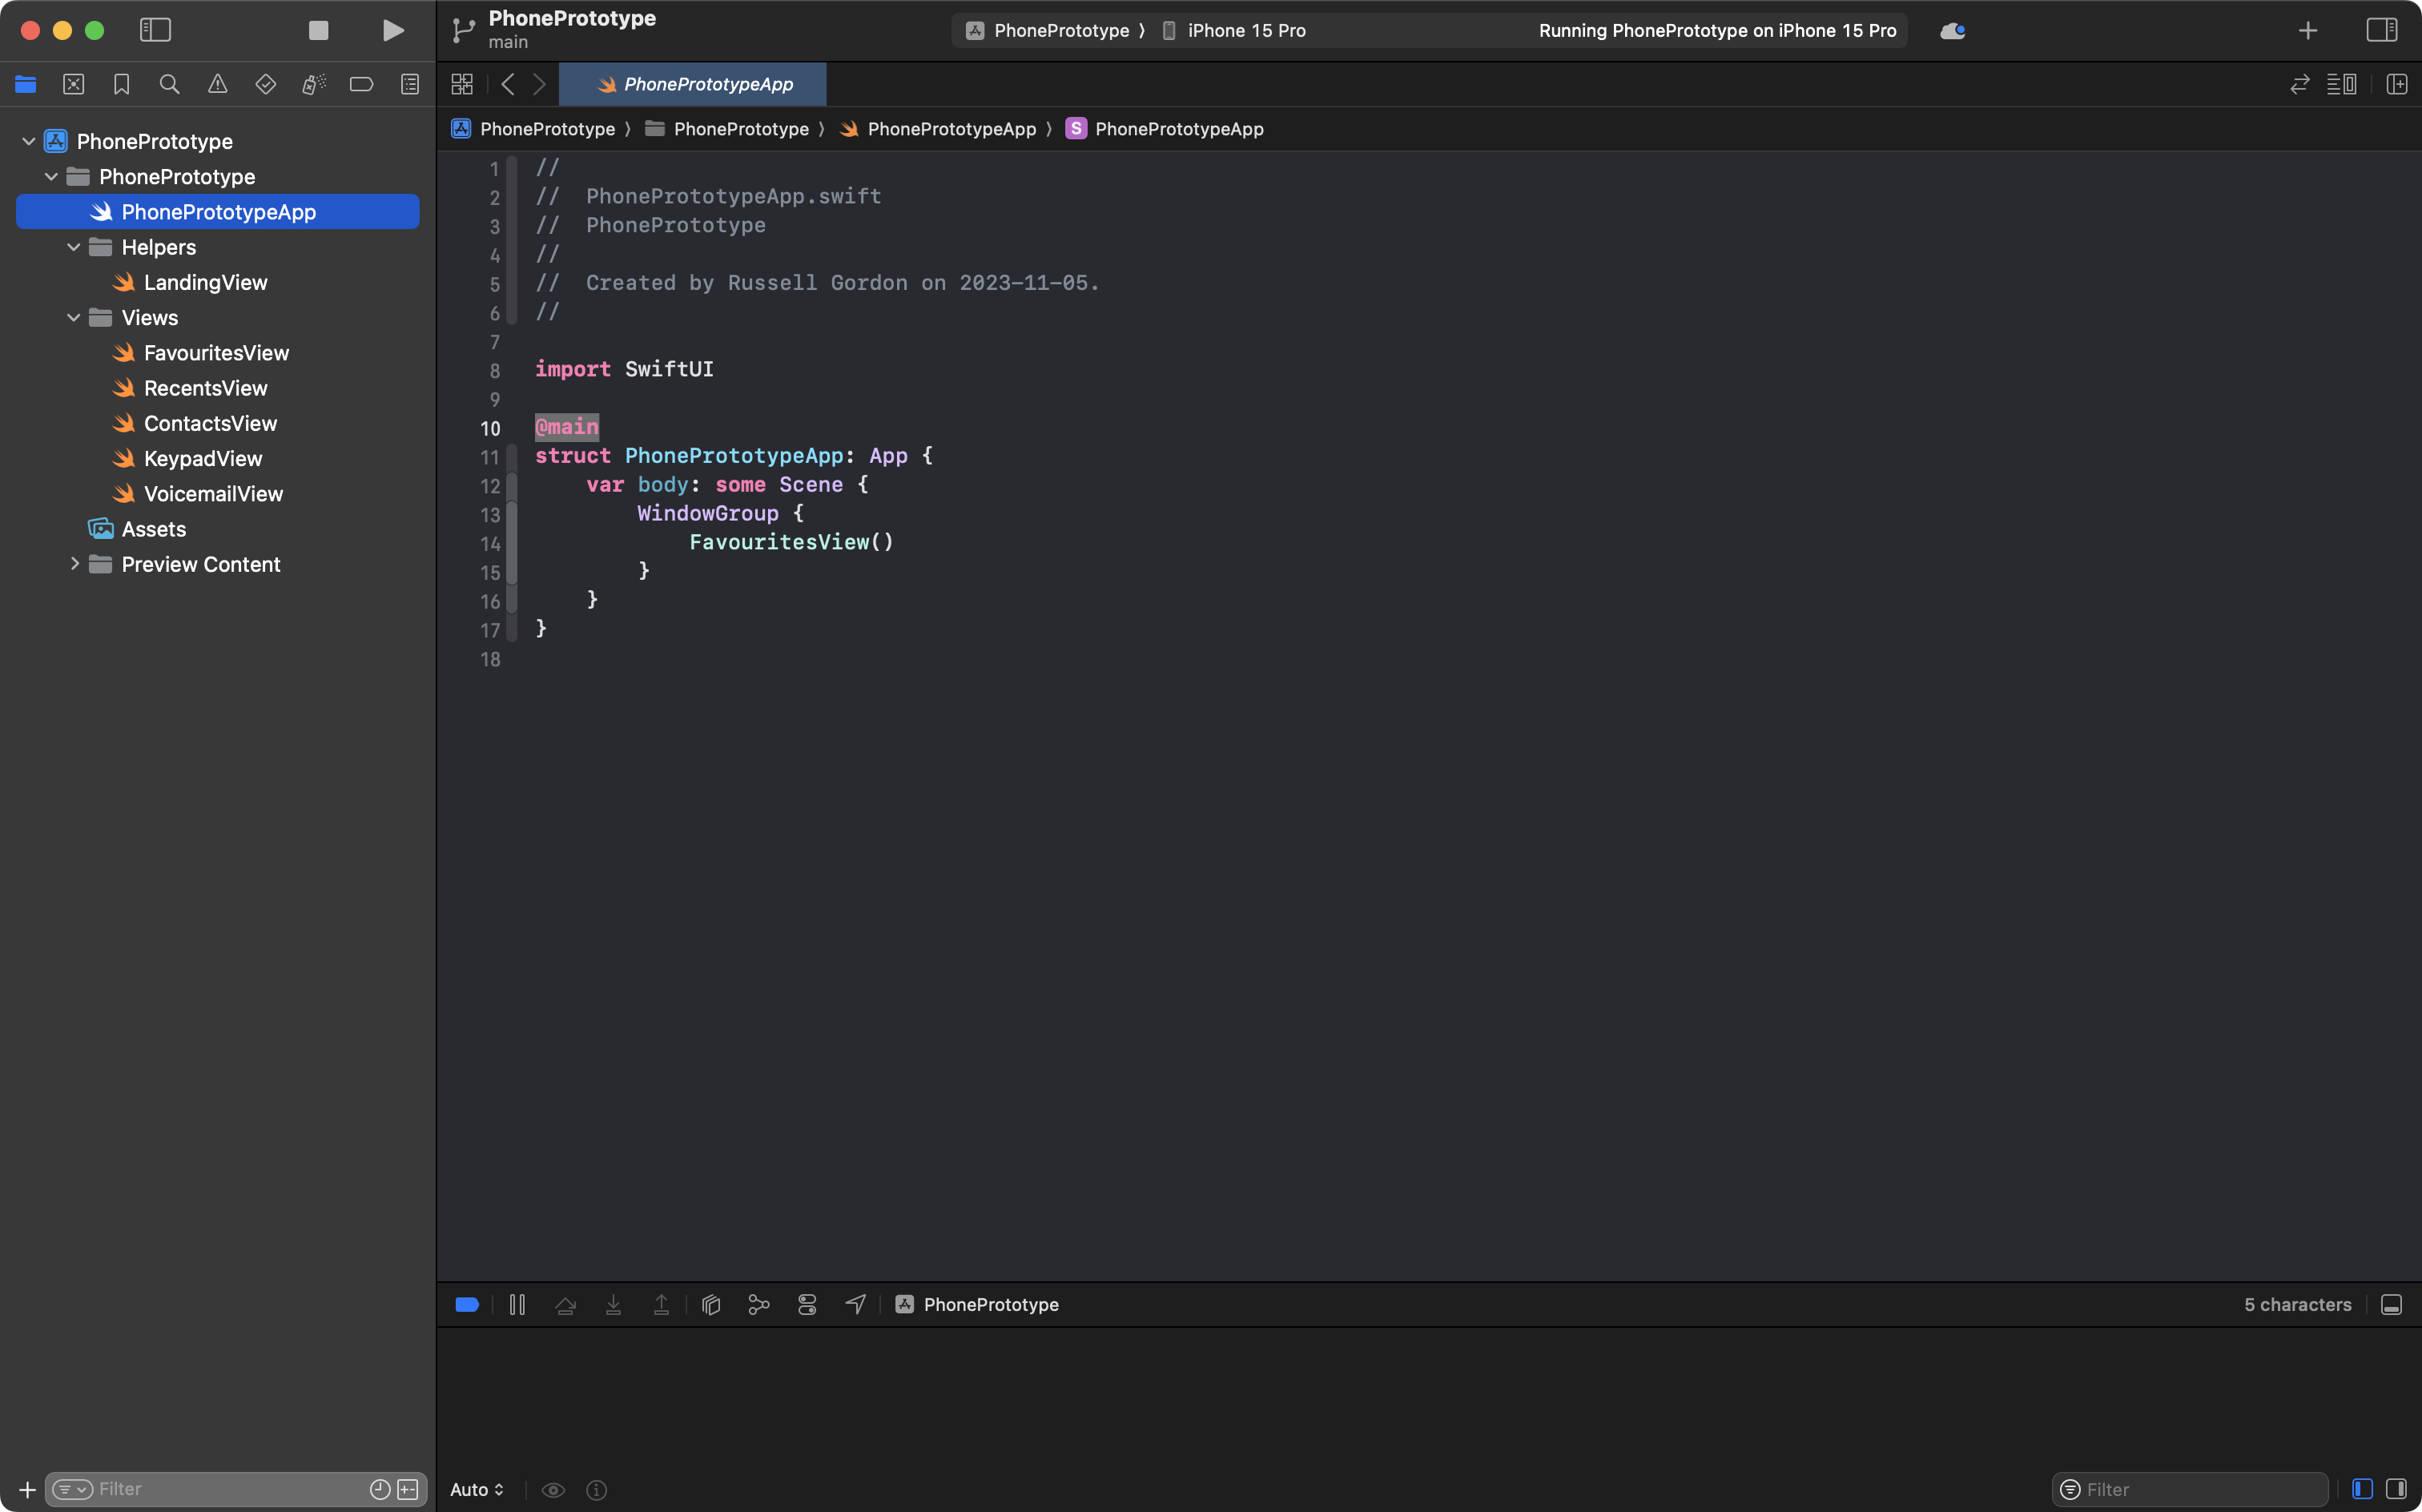
On line 10, you’ll note the following code:
@mainThis is referred to as the app entry point.
In the lifecycle of a SwiftUI app running on a device (or a simulated device) this is where your app’s code “begins”.
The PhonePrototypeApp structure, in this example, eventually creates an instance of FavouritesView, as shown on line 14:

That is why when we run the app in the simulator, we see this:
The app entry point is creating an instance of FavouritesView.
For this particular app, that is not very useful.
We can create an instance of whatever structure we want when the app opens.
For example – although this is not particularly useful either – we could instead create an instance of RecentsView:
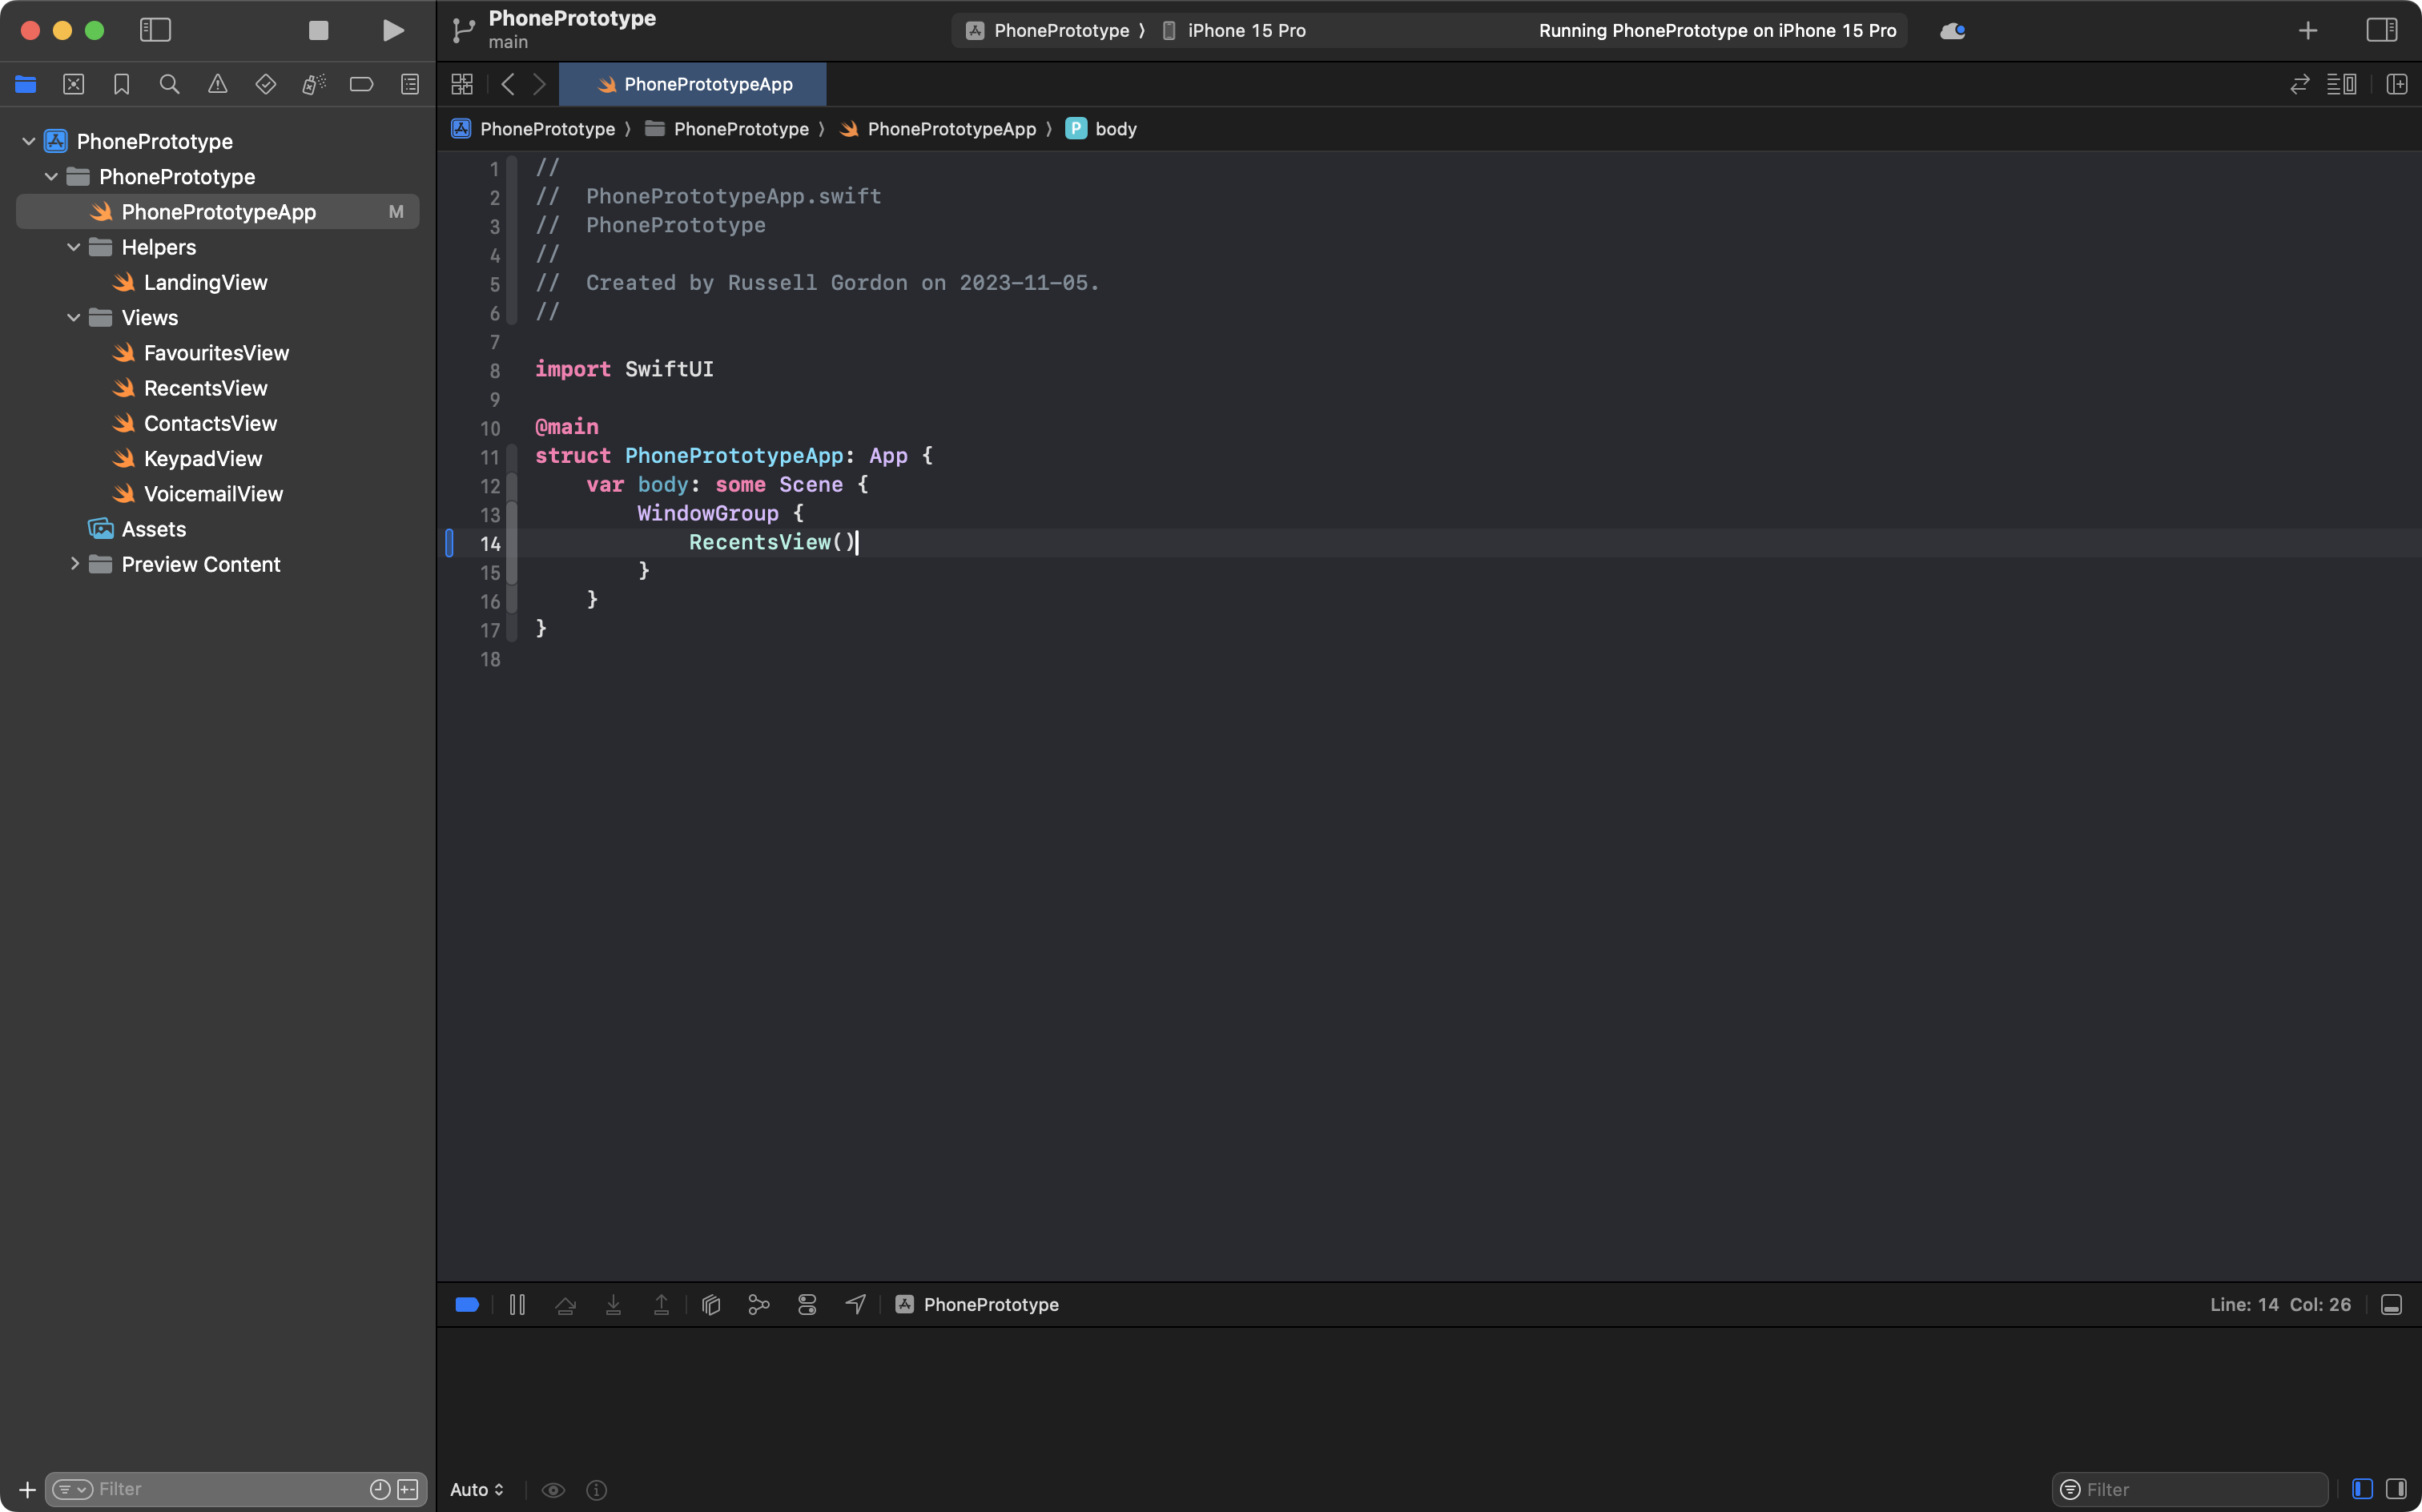
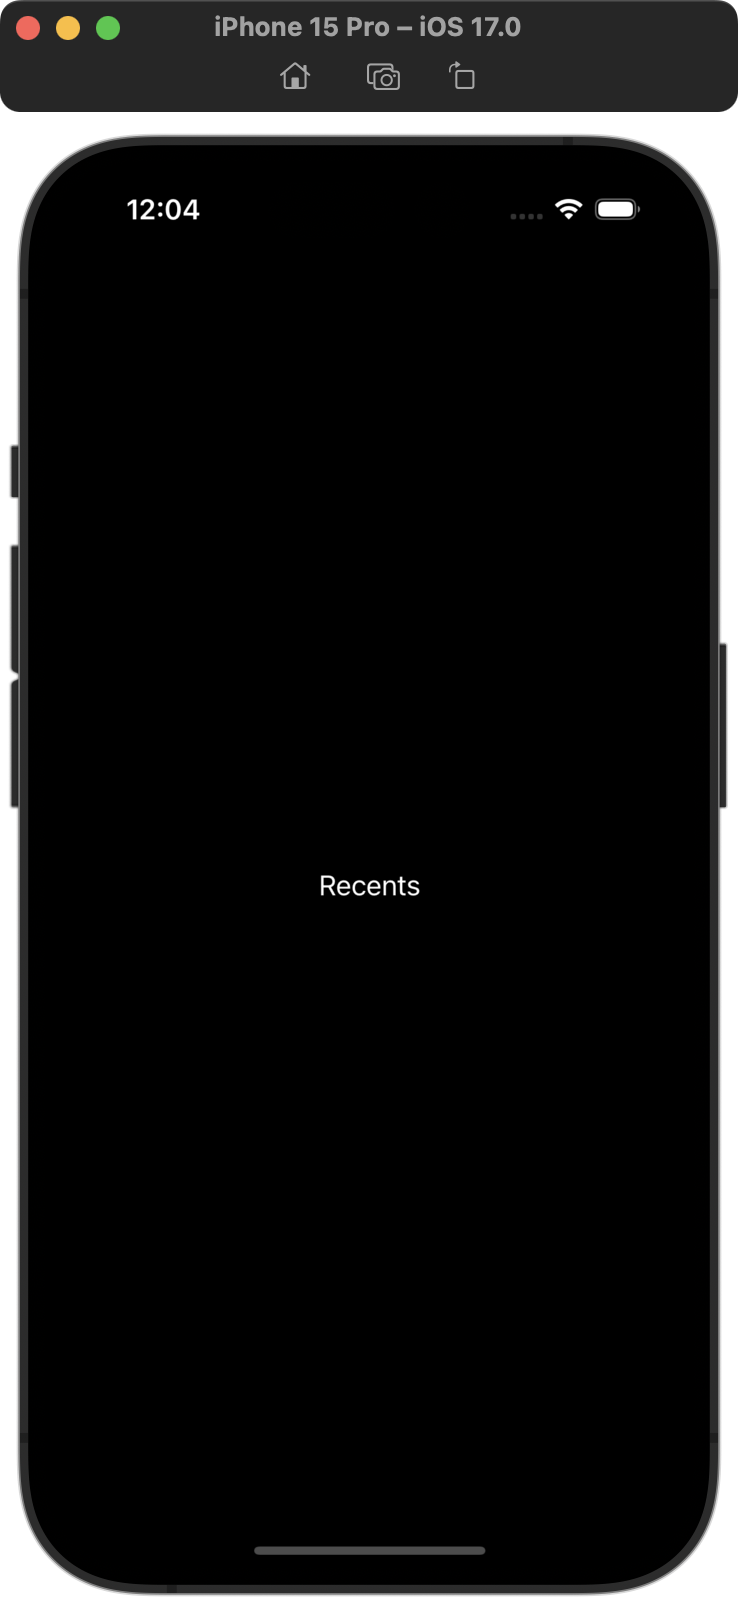
Then we when run the app again in the Simulator by pressing Command-R, we see this instead:
For this particular app, what we want to do is create an instance of LandingView because that is what (in turn) creates a TabView – that much is clear when we preview the LandingView file:
So if we want to see this same content when the app opens in the full simulator, this is the change should make at the app entry point:

Conceptually, this is what we now have:
flowchart TD

id1["App Entry Point\n"] --> id2["LandingView"]
id2 --> id3["TabView"]
id3 --> id4["FavouritesView\n(.tabItem)"]
id3 --> id5["RecentsView\n(.tabItem)"]
id3 --> id6["ContactsView\n(.tabItem)"]
id3 --> id7["KeypadView\n(.tabItem)"]
id3 --> id8["VoicemailView\n(.tabItem)"]
The app entry point creates an instance of LandingView.
LandingView creates a TabView.
Each tab item inside the TabView switches the app’s user interface to show an instance of one of these structures:
FavouritesViewRecentsViewContactsViewKeypadViewVoicemailView
Summary
When you want to test the functionality of just one view within your app, use the Previews window:
When you want to test how the app works as a whole, run it within the full Simulator (or test it on an actual physical device). When an app is run in the Simulator or on a device, the structure created by the app entry point file is what we will see:
.png)