Entity-relationship (ER) diagrams were created by Peter Chen, a computer scientist, in the 1970’s.
The purpose of an ER diagram is to help developers and designers come up with a data model for software.
There are many variations for the visual appearance and organization of ER diagrams.
We will use the original Chen notation as it is the easiest to draw by hand.
Once we have drawn an ER diagram, it can be converted into SQL statements that will define a database. We can then use that database with an app that we author.
Entities and attributes
Entities are described by nouns (a person, place, or thing) and are displayed in an ER diagram using a rectangle.
Attributes are the characteristics of an entity, and are displayed as ovals connected to an entity in an ER diagram.
For example, a patron of a library refers to a person who borrows books and uses other services of the library.
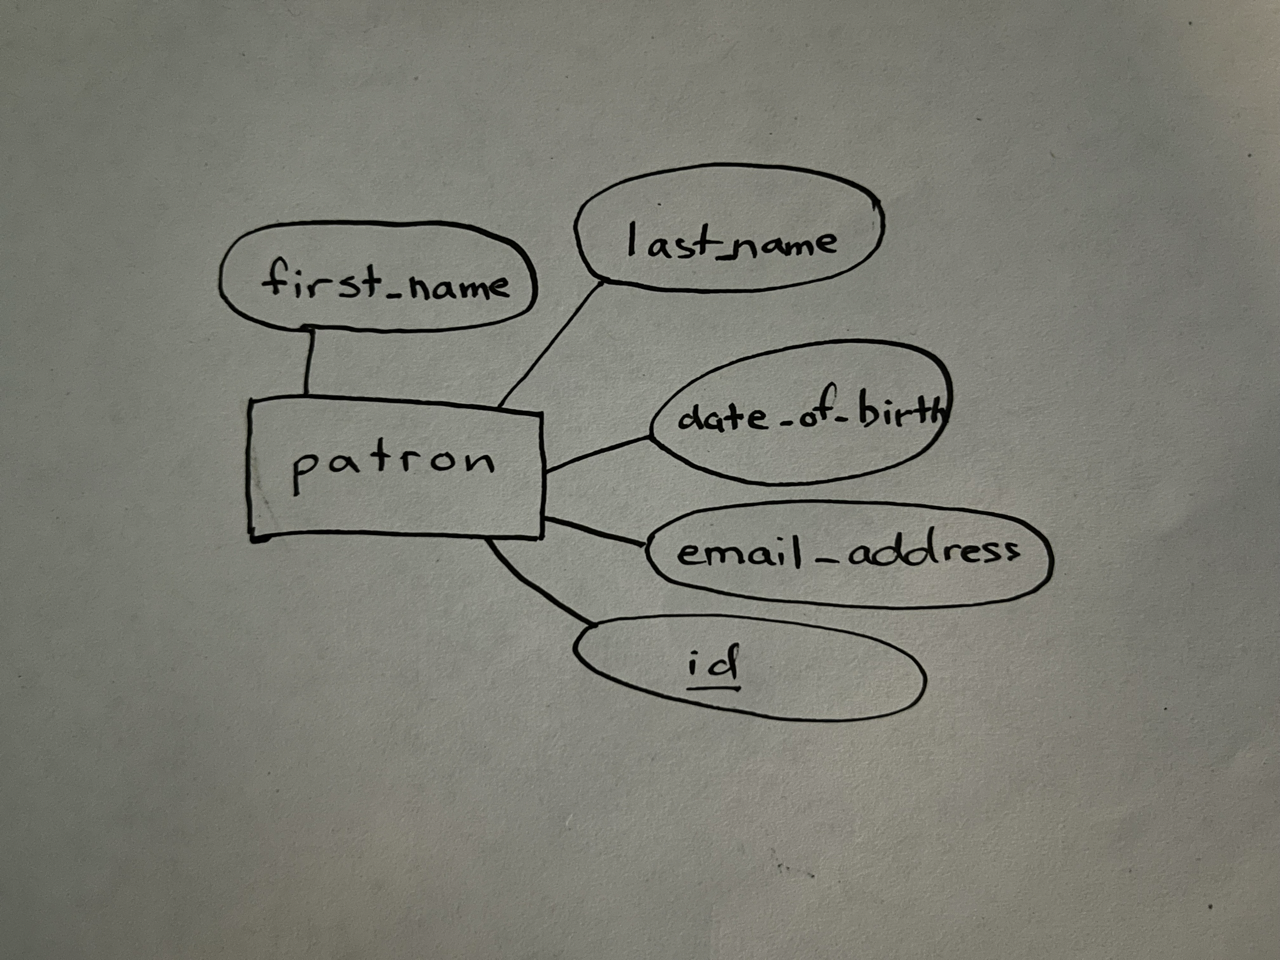
In an ER diagram to model the data needed to organize a library service, the patron would be an entity. Attributes of a patron might include:
- first name
- last name
- date of birth
- email address
- id (or library card number)
Here is what the patron entity we just described might look like:
Relationships
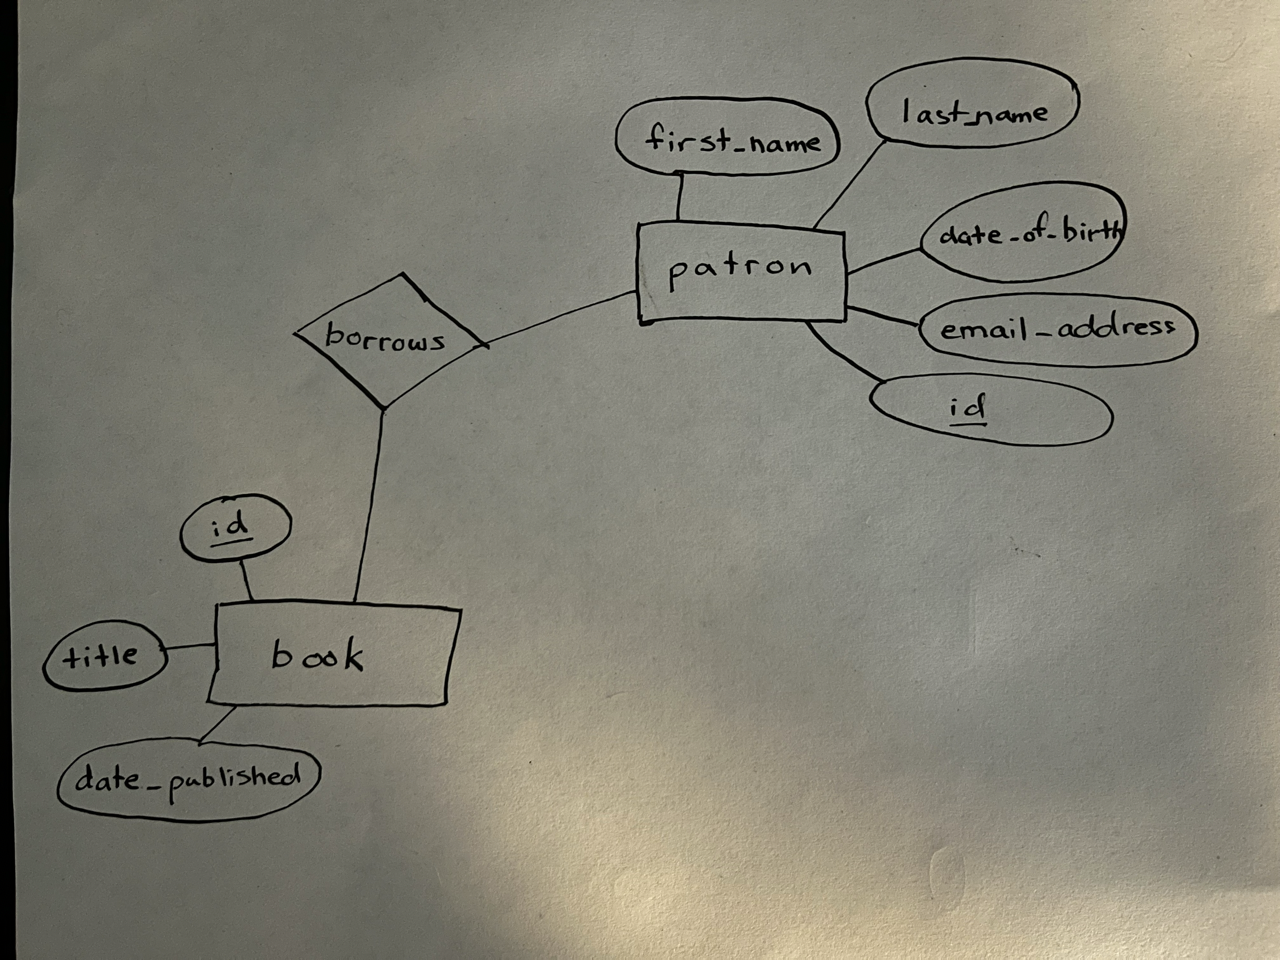
Entities are connected by relationships. For example, another entity in a library system would be a book.
Library patrons borrow books. Looking at the relationship in the opposite direction, books are borrowed by patrons.
Relationships in an ER diagram are marked by diamonds.
If we model the relationship between patrons and books in a library, the ER diagram might look like this:
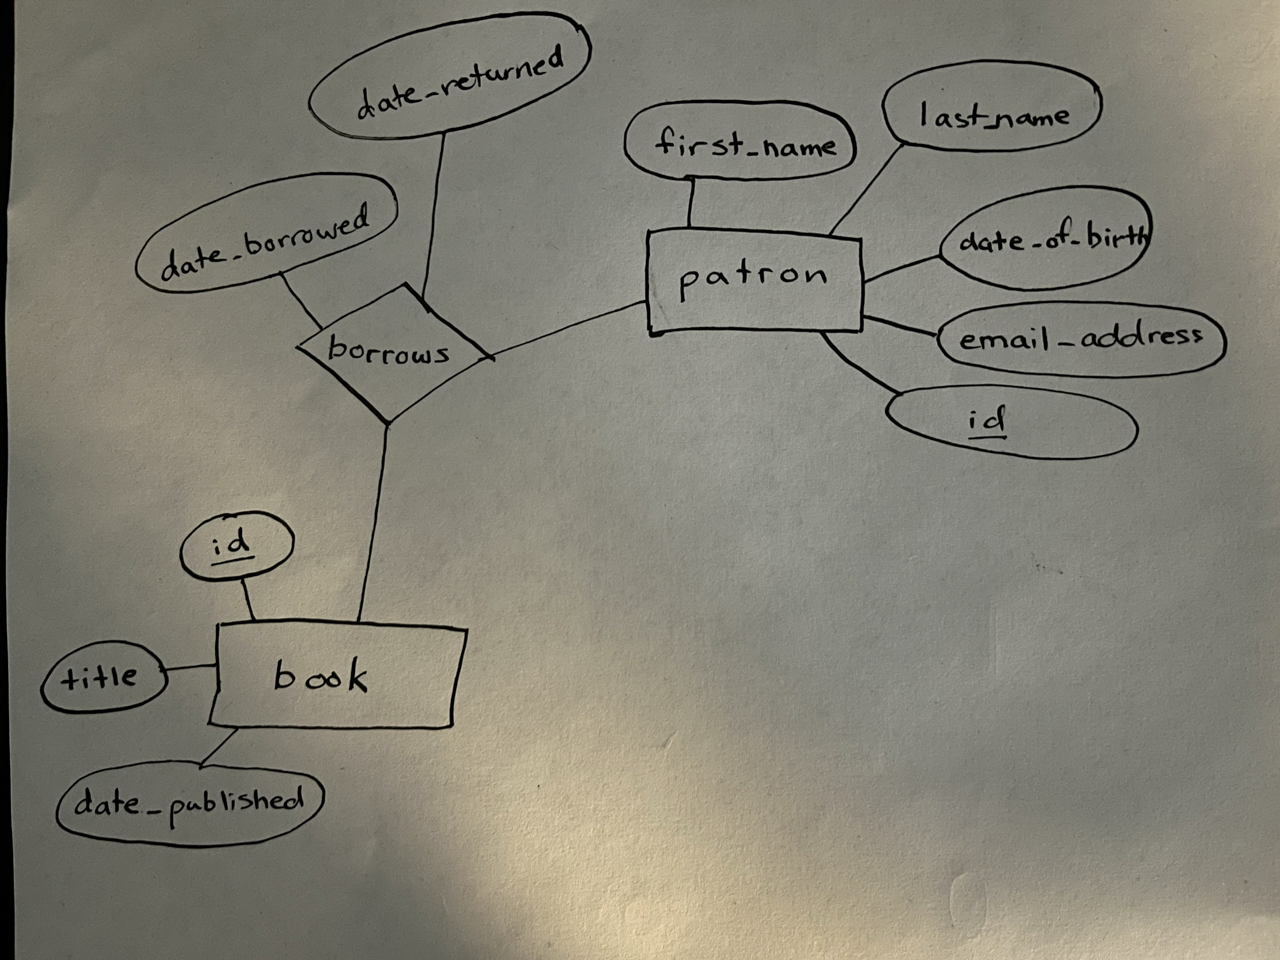
In some cases, relationships themselves can have attributes. For example, when a book is borrowed, we’d want to keep track of when the book was borrowed by a patron, and when a book was returned. The diagram might be expanded as follows:
Cardinality, part one
In our ER diagram so far, there is one relationship between the two entities.
Thinking of the relationship in each direction:
- book to patron
- A given book can be borrowed by many patrons over time.
- patron to book
- A given patron can borrow many books over time.
Put together, we see that there is a many-to-many relationship between these entities.
A many-to-many relationship is the default cardinality in an ER diagram. When entities are simply connected by lines, that means there is a many-to-many relationship between them.
Entities vs. attributes
Sometimes extra thought is required to decide what should be an entity and what should be an attribute in an ER diagram.
For example, each book has a genre.
Dune, by Frank Herbert, is a well-known science fiction novel.
Pride and Prejudice, by Jane Austen, is a famous romance novel.
So when should the genre of a book be an attribute in an ER diagram, and when should the genre of a book be an entity of it’s own?
Ask yourself – how often would a value – a particular genre in this case – be attached to a book?
Lots of books are romances, so that text – romance – would be attached to a book over and over again. The same is true of any given genre. We wish to avoid repetition, so when thinking of books, the genre should be it’s own entity.
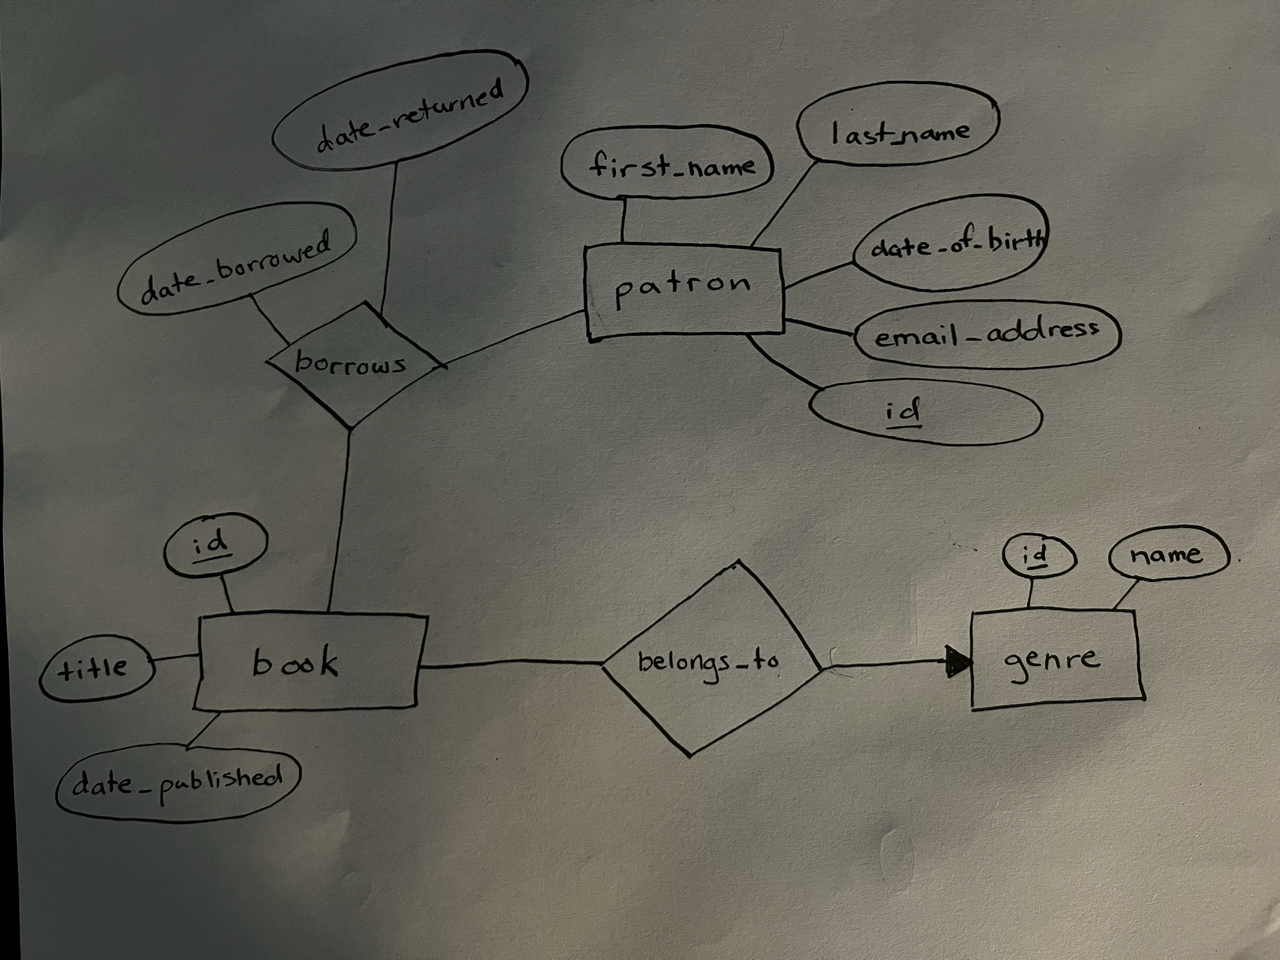
We might then expand the ER diagram as follows:
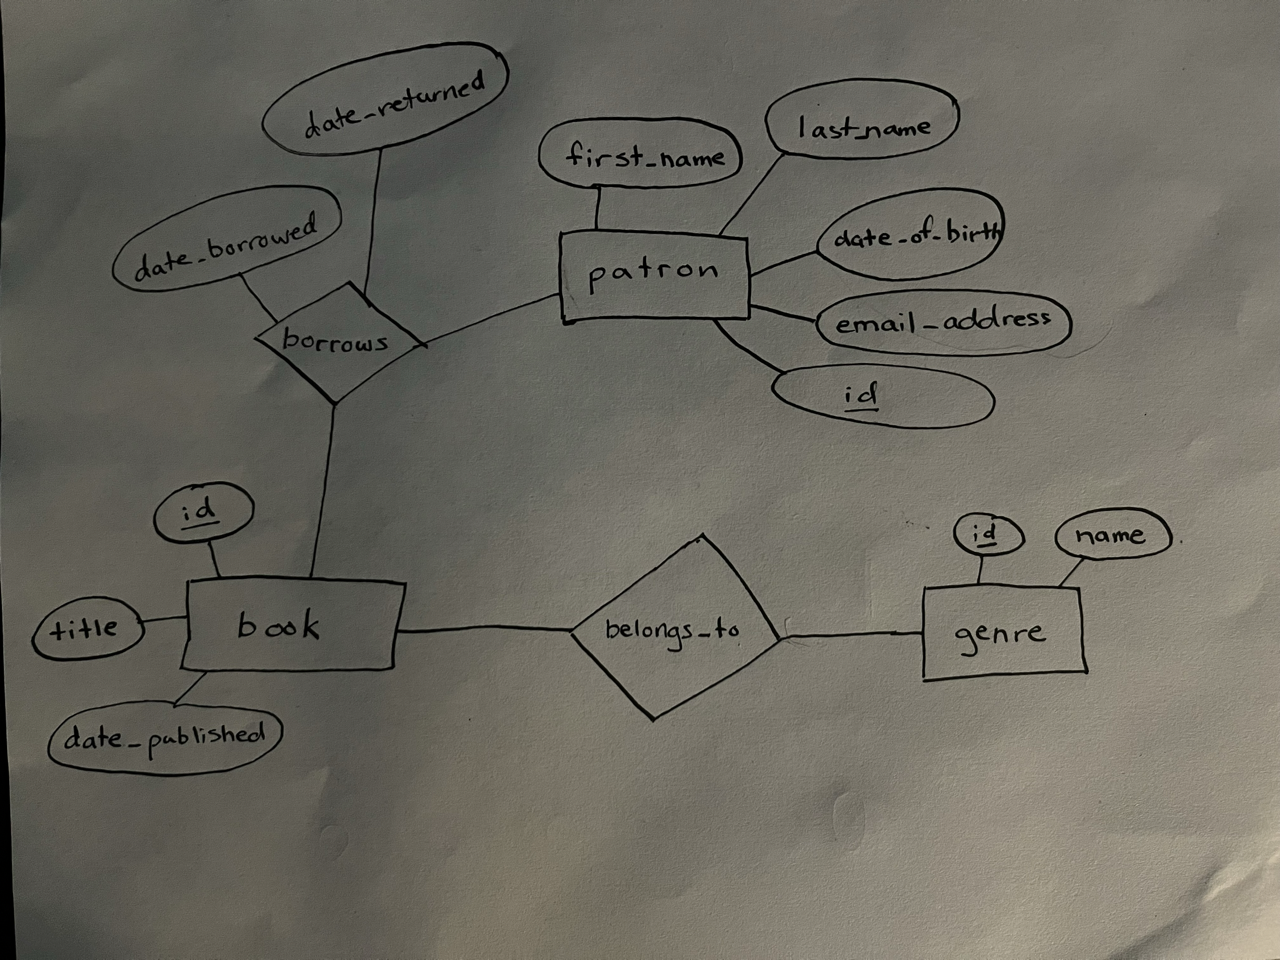
If information that describes something is likely to be unique most of the time, that should be an attribute – notice that, for example, the title of a book is listed in this diagram as an attribute.
Cardinality, part two
Now let’s reconsider that relationship between a book and a genre. We always begin by drawing lines between entities when connecting them with a relationship, which means the cardinality is many-to-many. That is what exists right now between a book and a genre:
Looking at the relationship in each direction:
- book to genre
- A given book can fit in many genres.
- genre to book
- A given genre includes many books.
This many-to-many cardinality fits, in theory. Some books do have elements from multiple genres. For example, Outlander by Diana Gabaldon is considered by many to be a romance novel, but Mr. Gordon, who has read and enjoyed this novel, is not alone in pointing out that Outlander has elements of science fiction and historical fiction as well.
Alas, when Mr. Gordon went to Knotanew Books in Peterborough to purchase a copy of Outlander, he was referred by the owner of the book store to the romance section.
When librarians shelve books, they need to pick a single section in which to place that book as well.
So, we can revise the relationship between book and genre as follows:
- book to genre
- A given book (in a library or bookstore) is assigned to one genre.
- genre to book
- A given genre (in a library or bookstore) includes many books.
Where the cardinality is one, we add an arrowhead, as follows:
Looking from book to genre, overall now, we say there is a many-to-one relationship.
Looking from genre to book, overall now, we say there is a one-to-many relationship.
Unique identifiers
Each entity typically has a unique identifier as one of it’s attributes. We denote this by underlining the attribute name. In each of the entities we have defined in the ER diagram, the unique identifier is listed as id. This is a common practice.
Conversion to a database
Data architects model the data in systems much like we have just done. This is a lucrative occupation within the software industry.
Data architects typically use specialized software to draw ER diagrams.
That software can then directly map a diagram to the necessary SQL statements that will create a database – with all the necessary tables that describe the entities, their attributes, and the relationships between entities.
For small ER diagrams, generative AI works reasonably well to create the necessary SQL statements.
The steps involved are:
- take a clear photo of your ER diagram
- convert the photo to JPEG format using the Preview app on macOS
- upload the photo to ChatGPT and provide an appropriate prompt to have it generate SQL that matches the ER diagram
- ask ChatGPT to build on it’s initial output and generate example data, so that the database tables can be populated with information you can work with at first
Mr. Gordon will guide you through this process.
Here is a prompt that might be used with the the ER diagram we just authored:
This is a photo of a hand-drawn conceptual entity-relationship diagram. The diagram describes the data that will be stored by a library service to track what books patrons have borrowed. Please convert this image into valid SQL that will create database tables with columns, primary keys, and foreign keys where appropriate based on the cardinality described in the diagram. Do your best to infer data types for table columns based on the name of attributes given for each entity. Be certain that the SQL you generate is compatible with the PostgreSQL database software.
You can fill in the blanks, like this:
This is a photo of a hand-drawn conceptual entity-relationship diagram. The diagram describes the data that (INSERT DESCRIPTION OF SYSTEM HERE). Please convert this image into valid SQL that will create database tables with columns, primary keys, and foreign keys where appropriate based on the cardinality described in the diagram. Do your best to infer data types for table columns based on the name of attributes given for each entity. Be certain that the SQL you generate is compatible with the PostgreSQL database software.
For the follow-up prompt, for the ER diagram we authored above, we might use the following:
That's great, thank-you! Now given the SQL you just produced to create the database tables that matched the ER diagram, can you produce some further SQL that will populate each table with reasonable sample data? Ensure that there are at least five patrons, across three genres, and at least ten books.
You can fill in the blanks, like this:
That's great, thank-you! Now given the SQL you just produced to create the database tables that matched the ER diagram, can you produce some further SQL that will populate each table with reasonable sample data? Ensure that there are (INSERT THE NUMBER OF DESIRED ROWS OF EXAMPLE DATA IN EACH TABLE).